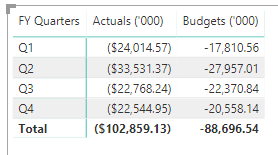
I just went through the financial reporting scenario method workshop and I’m having trouble with getting my visualization to work. I’m at the part where I put the “FY Quarters” in the Columns part of the visualization. When I do this however, the model won’t break the numbers out between the quarters. It only repeats the actuals and budgets columns in the visual. How do I fix this?
@Ben182
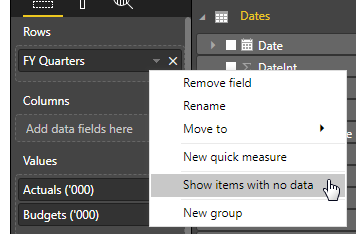
Generally when see things like this it means there’s an issue with your data model and relationships. First thing I like to do is see what happens when I tell the visualization to show items with no data:
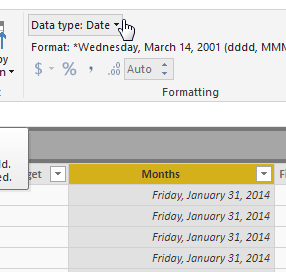
Doing this will show your FY quarters, but still no data. So more than likely a data modeling issue. Could be a filter couldnt reach to where you’d expect, a wrong type of relationship, etc. Luckily your issue was that you were relating the Date table to the Fact table by two different data types. Your “Months” column in the Financial Data table was set to text, while your Date table Date column was set to Data. Simply change the months from Text to Date and you should be set: