Finance Matrix Months & Variances

Hi Folks,

I am wondering whether anyone has managed to create a finance related matrix that allows you to have the months but also variance to budget at the end as per Excel example below? Preferably without paying for a custom visual like Inforiver etc?

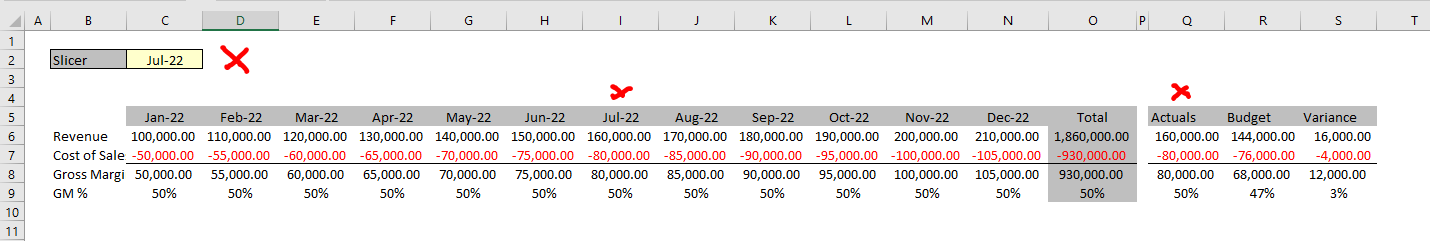
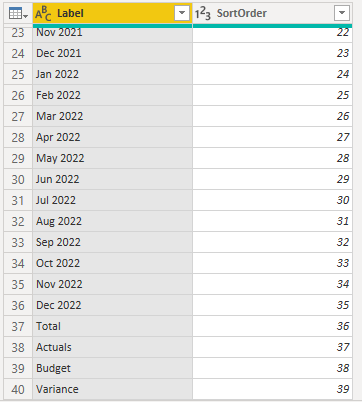
Creating the first part of the matrix columns B to O is easy enough, the hard part is also having the months actuals (Column Q) and the budget (Column R) per the month slicer with the and variance of these two columns in (Column S) all within the same matrix visual.

I can do this using two seperate visuals side by side but this method does not work well when you drill down in your report as then side by side visuals go out of sync and you also have to drill down two seperate visuals which is all a bit rubbish and not user friendly.

I did read somehere that this was possible using calculation groups but i’ve not found any vidoes / blogs on how to do this.

Any help would be appreciated, thanks.

Hi @BCS,

This is the only method I know but its not pretty… Here we go.

Go to the Query Editor and create a table with the prefered date dimension and append a table with the other dimensions like; Total, Actuals, Budget and Variance. Add an Index column so you can properly sort the values in your visual.
Leave this as a supporting table so there is no relationship to other tables in the model.

image

I used this:

let
    Source = Table.Distinct( Dates[[#"Month & Year"]] ),
    #"Renamed Columns" = Table.RenameColumns(Source,{{"Month & Year", "Label"}}),
    Custom1 = #"Renamed Columns" & Table.FromColumns( {{ "Total", "Actuals", "Budget", "Variance" }}, {"Label"} ),
    #"Added Index" = Table.AddIndexColumn(Custom1, "SortOrder", 0, 1, Int64.Type),
    #"Changed Type" = Table.TransformColumnTypes(#"Added Index",{{"Label", type text}})
in
    #"Changed Type"

.
Create all your measures and one for your matrix, a SWITCH/TRUE something like:

Revenue =
VAR Selection = VALUES( Dates[Month & Year] )
VAR AllSelection = ALLSELECTED( Dates[Month & Year] )
RETURN

SWITCH( TRUE(),
    SELECTEDVALUE(ColumnList[Label]) = "Total",
        CALCULATE( [Sales],
            Dates[Month & Year] in AllSelection
        ),
    SELECTEDVALUE(ColumnList[Label]) IN VALUES( Dates[Month & Year] ),
        CALCULATE( [Sales],
            TREATAS( VALUES( ColumnList[Label] ), Dates[Month & Year] ),
            ColumnList[Label] in selection
        ),
    SELECTEDVALUE(ColumnList[Label]) = "Actuals",
        0,
    SELECTEDVALUE(ColumnList[Label]) = "Budget",
        0
)

.
Add a matrix to your canvas, dragg the ColumnList[Label] to the Columns. Dragg your SWITCH/TRUE measures to the values section and in the settings enable “Switch values to rows”. With this result, note I used the same pattern for COGS.

I hope this is helpful

3 Likes

Thanks very much @Melissa that is a great solution!!