Hi,
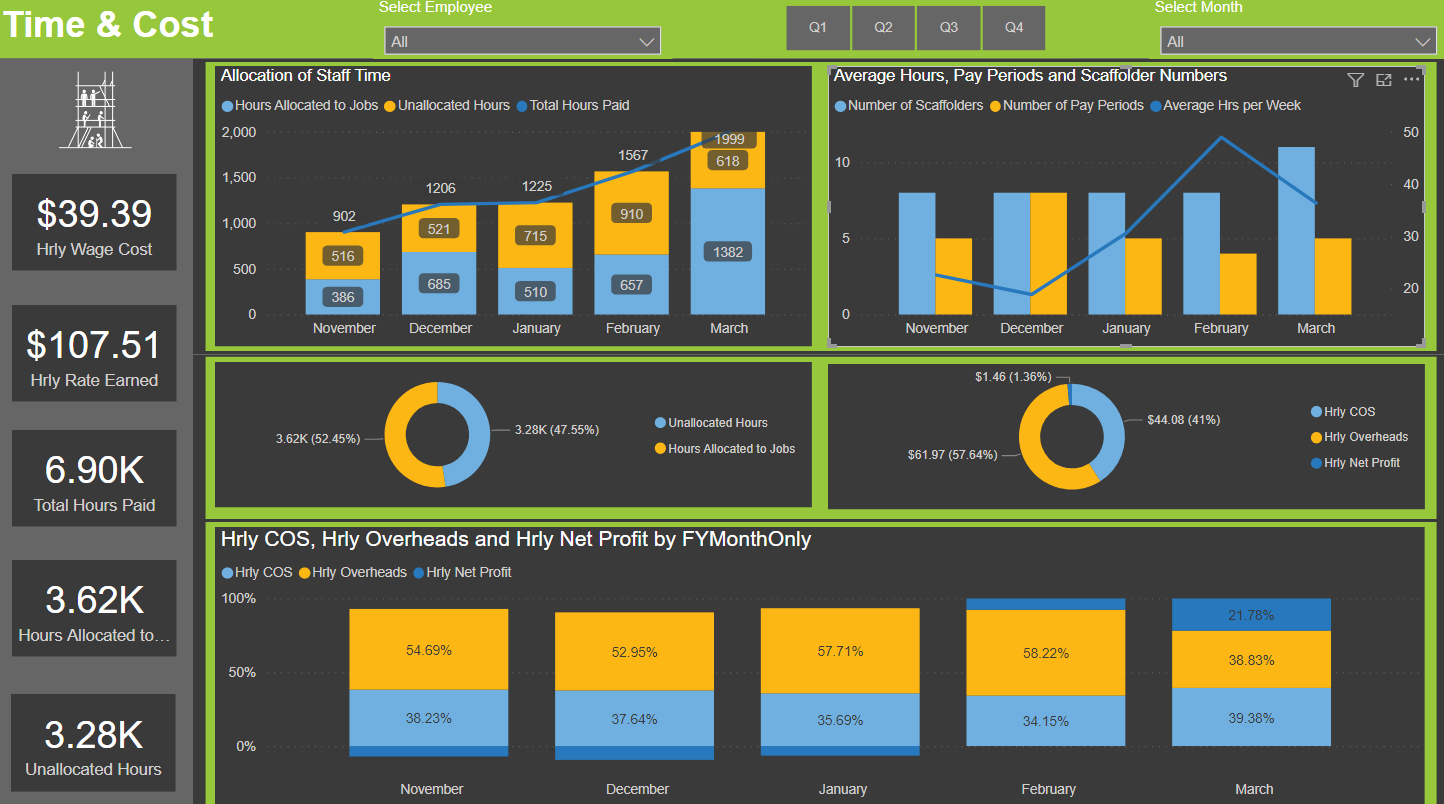
I’ve got a report that I run for a client every month. This month, something odd has happened to one of the pages. The page was added last month and worked fine. It includes some data that was only available from November, so I have filtered out all data from prior to November so that the results aren’t skewed and the visuals make more sense. Last month I filtered out all dates except Nov - Feb. Now, after March month end, I have extended the range to Nov - Mar. On Power BI Desktop, everything looks and works as I want it to, however when I publish to the Power BI service, the filter range is on in some instances and off in others. I’ve attached two screen shots so you can see the differences:
-
The Power BI desktop only shows Nov - Mar as I want it to on the bar graphs
-
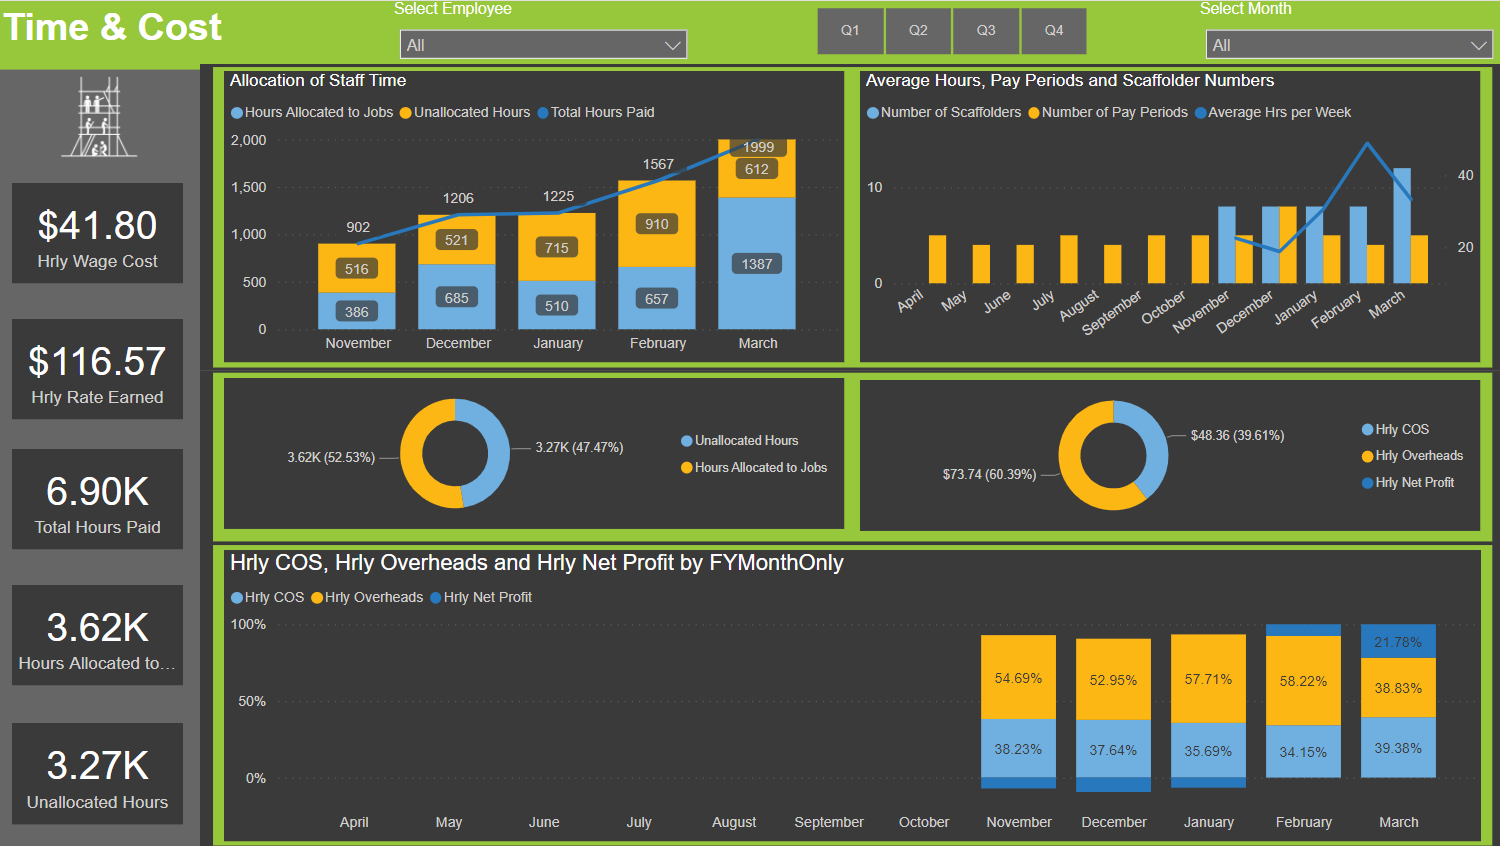
The Power BI Online Service shows all months for two of the three graphs whilst displaying the third graph (top left hand corner one) as I want it to
In addition to these, if I select March as the month using the slicer, two cards on the left (Hrly Wage Cost and Hrly Rate Earned) display BLANK in the online service whereas desktop shows the correct numbers. Again, this is because the filters I put on those visuals in Desktop are not holding in the Online Service.
Can anyone shed any light on why the Online Service is doing this please? I’ve also edited the report in the Online Service to put the filters back on and saved my edits. However, once I go back into reading view, my edits have gone again.
Oh … and yes, I know the numbers between the online and desktop version for some visuals are different. That’s for a similar reason i.e. I’ve filtered out a temporary contractor in one version and in the other, that filter is also dropping out.
Any ideas?