I have a problem with the filtering the visualizations on a PBI report.
The problem manifests itself whenever I attempt to filter between any of the visualizations on the report. For the purposes of explanation, I’ll use a Donut Chart and a table.
If anyone wishes to explore this issue, please use the ‘Client Details’ page of the PBI report.
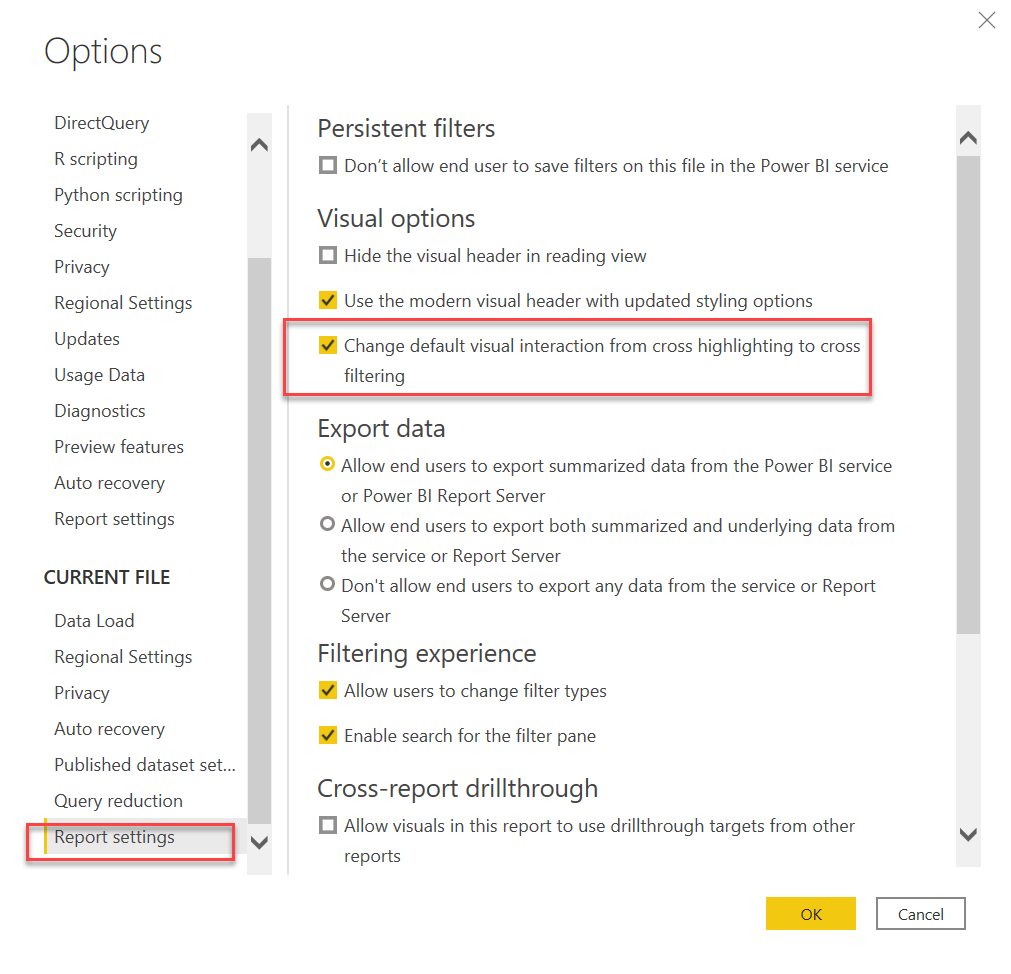
Essentially, the filtering is inconsistent. Before going any further, I’ve checked the Editing Interactions between the visualizations. After “activating” the Donut Chart, I turn on the Filter in the Table, I wish to filter. If I click one of the segments of the Donut Chart, it will filter the Table correctly. After that, the filtering becomes inconsistent. If a click on another segment of the Donut Chart, it may filter the table, or it may not. Eventually, the filtering fails.
Context
I’m creating a report that is based upon the “Banking Clients” XL file from the Practice Data folder in Edna.
When I examined the file, I noticed that there were duplicates based upon Client ID. That is, there were multiple Bank Clients with different names having the same Client ID. I eliminated the dups until there was a one-to-one relationship between Client ID and Client Name. Also, I deleted all blank rows in the XL file. The file I imported into PBI contained 2949 records.
In PQE, I transformed the data until I had two tables, one Lookup table, one Fact table, each with 2949 rows. The Lookup table contained basic identifying data for each Bank Client to be used for filtering, the Fact table contained data about account and loan balances, essentially dates and numbers.
I tried to establish a “One to One” relationship between the tables with a Cross Filtering Direction = Single. PBI flagged an error, “The filter direction you selected isn’t valid for this relationship”. I then established a “One to Many” relationship from the Lookup table to the Fact table. I reviewed the modeling - it shows a One to Many relationship flowing from the Lookup table to the Fact table.
Here are the PBIX file and the underlying XL file.
Banking Clients.xlsx (900.9 KB)
Banking Clients.pbix (1.1 MB)