I have a Working Hours table with a Date column containing the first day of the month and a column with the Working Hours reported for each month.
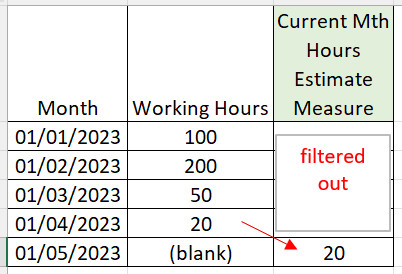
I need to create a measure that returns a value only for the current month (in this case the date on my table would be 01/05/2023), but this value needs to be the working hours reported for the previous month (01/04/2023). That is, I want only a value for May 2023 and this value should be the working hours for April 2023.
Here is an example of what the measure (right hand column) would look like when on a table:
So far, I have managed to create a measure that returns the value for the same period last month:
Same period last month = CALCULATE([Total Hours], DATEADD(Working_Hours[MonthDate], -1, MONTH))
But I have not managed to filter the table so it returns a value for the month of May based on the hours for the month of April, as when filtering April out, obviously, April’s data disappears.
If you are trying to show only the last value in the column based on the max date in the visual, does the below measure help, or is there some further logic?
In order to force a blank I ran a comparison between the lines date and the max date and if it matches show the measure, else if no false condition is provided it returns blank.
Same period last month =
VAR SelectedMonth = MAXX(ALLSELECTED(‘Working Hours Table’[Month]),‘Working Hours Table’[Month])
VAR Result =
IF(
SELECTEDVALUE(‘Working Hours Table’[Month]) = SelectedMonth,
CALCULATE([Total Hours], DATEADD(‘Working Hours Table’[Month], -1, MONTH))
)
RETURN
Result
I have continued working with this measure, but I need it to work in a new context and so far I couldn’t figure out how to adapt the measure to this new requirement.
I have a measure that calculates the last 12 months’ working hours, to which I have added the measure you kindly sent, which we previously called [Same Period Last Month] and I have now renamed as [Current month hours estimate] :
With this measure and another one that calculates the number of events for the last 12 months, I create this simple calculation:
12MTH_LTIF KPI with estimate = IFERROR(([12MTH_LTI Events]*10^6)/[12mth Working hours with estimate],0)+0
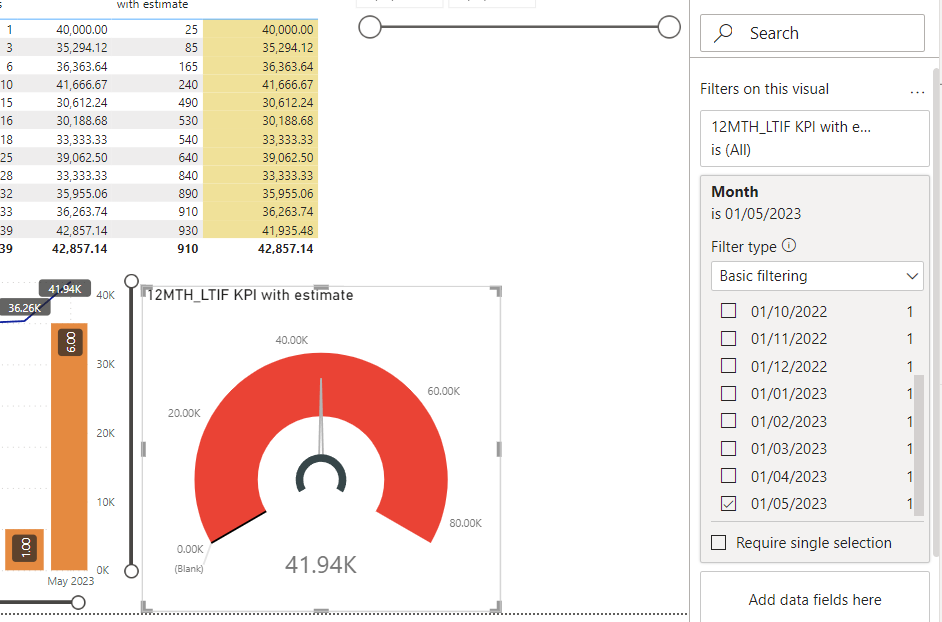
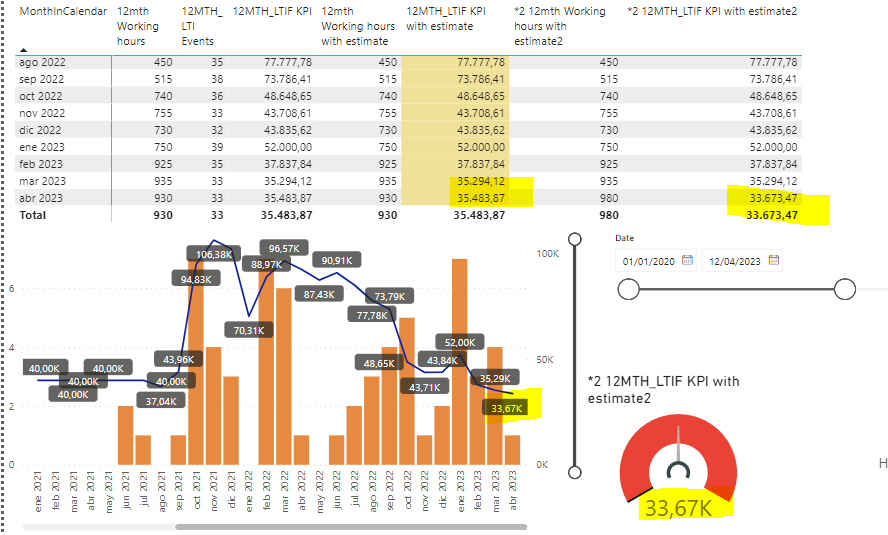
This final measure works perfectly in a line & bar chart, where the line represents this [12MTH_LTIF KPI with estimate] and the bars show the number of LTI Events for each month. However, when I try to get the current 12 month LTIF KPI value on a tachometer, this does not include the estimate calculated in measure [Current month hours estimate]. I have taken a screenshot of all this, which you can see attached.
What I need, in this example, is for the tachometer to show the same value as the blue line (bar & line chart) and the raw with date 01/05/2023 (table, yellow column), that is 41,935.48. Instead, it shows the value without including the [Current month hours estimate]. Working Hours Example.pbix (3.3 MB)
You have to be very careful with totals in PowerBI, they display the measure with no filters applied, and would be based on the numbers you see at the bottom of the grand total, which are the measures calculated with no filter context, you can see it in the total hours, and LTI events, you would need to change all the measures, but that would cause the totals to look crazy, and not be what you expect at all, it would be best to hide the grand total row if you didnt want it to display, or explain to the user why it is showing that.
As for the KPI chart, it would be the same reason, a simple fix for that would be to add a filter, you can create a measure that returns a 1 when the month is the MAX month put that in the visual filter and set the value to equals 1, below is a screenshot of just placing a filter to show the result.
I would be happy to change all measures and to hide the totals line, as I don’t really need it. What I do need is:
For the line and bar chart to always show the 12 month rolling value for each month on the graph (the number of months displayed will be managed via a relative date slicer.
For the dial gauge to show the current 12 month rolling value, based on the current date. Ideally, this would show the current date value and not need to interact with the date slicer.
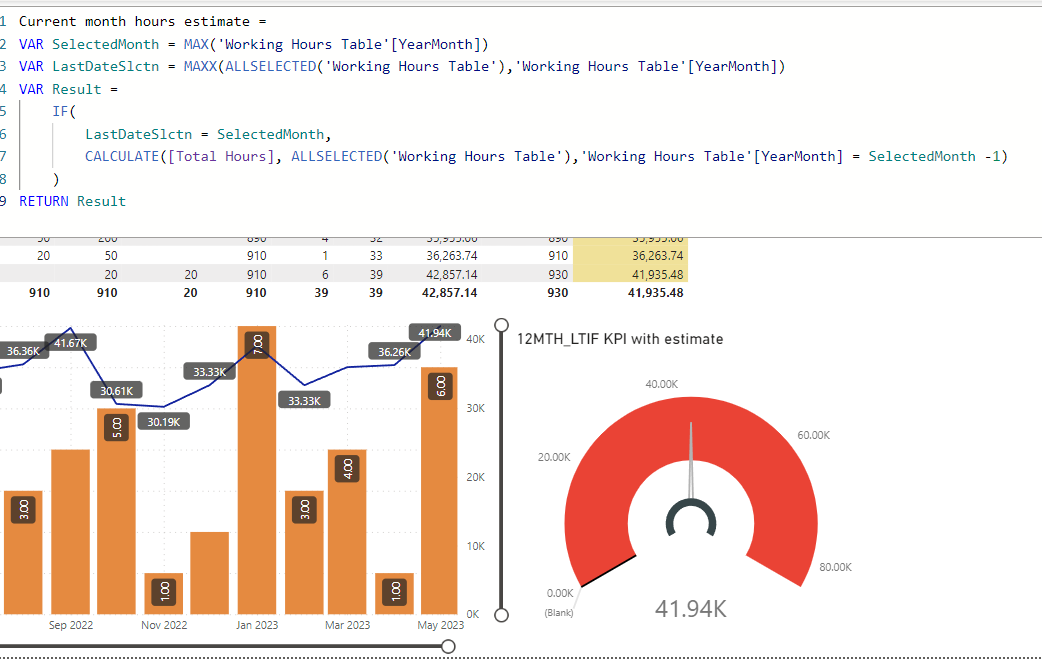
Could you help me adapt the measure below to work in both those contexts?
Current month hours estimate =
VAR SelectedMonth = MAXX(ALLSELECTED(‘Working Hours Table’[Month]), ‘Working Hours Table’[Month])
VAR Result =
IF(
SELECTEDVALUE(‘Working Hours Table’[Month]) = SelectedMonth,
CALCULATE([Total Hours], DATEADD(‘Working Hours Table’[Month], -1, MONTH))
)
RETURN Result
That measure works fine on the bar and line chart, but not on the dial gauge, so I created this alternative measure for the dial, but it is still not doing what I need. I could create a hidden slicer for the dials, but I am sure this is not the best solution. Here is the measure I’m using:
This new approach works better in a way, but it has one issue: although it works fine in detecting the date selection established in the slicer, it is adding the estimated hours value to the last month selected. The estimation should always be added to the current month, as the Power BI file is connected to a database where hours are reported, for each month, at the beginning of the following month.
With this measure, for example, if I choose to have April 2023 as the cut out date in the slicer, the line chart, dial gauge and table are returning the same value, which is good.
The bad thing is that the estimation is then being added to April instead of May. The problem with this is that the month of April already has hours in the database and the reason I need to add an estimate to the month of May (current month) is that hours for May will not be uploaded until the beginning of June, whereas LTI incidents are added to the database in real time.
I hope that makes sense. Is there an easy way to change the measure you sent so that it adds the estimation to the Current month only? Working Hours Example.pbix (347.3 KB)
This worked up to a point, as far as I have a row of data for the current month. However, if no hours have been reported for the month of May, there will be no estimation value in that month and the estimation will be added to the previous month (in this case, April) Working Hours Example2.pbix (365.0 KB)
. I need a measure that takes the current month from TODAY and not from the MAX value on the database.
I have no idea how to adapt all of this without losing all the things that were working fine in the measure I currently have (thanks to all your help!) Can you help with this once more?
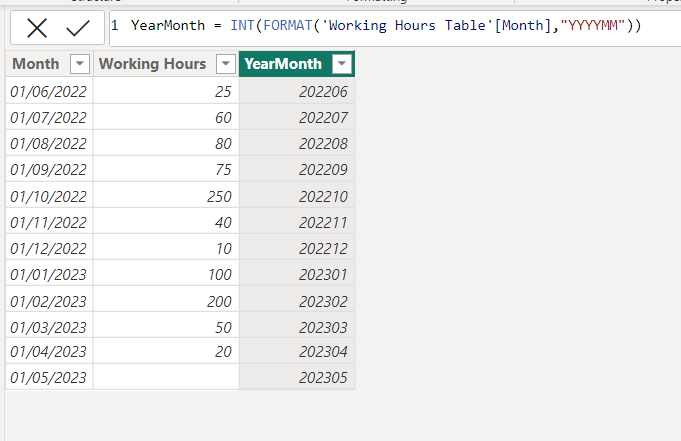
You should be able to edit the variable with the yearmonth you are trying to check the current selection against, be careful though because you are now using a date table, and this measure was not pointing to the field in the visual, if you change the field and the variable it should show estimated hours next to the current month
*2 Current Mth H Estimate =
VAR selectedmonth = MAX('Date table'[YEARMONTH])
VAR lastdateslctn = INT(FORMAT(TODAY(),"YYYYMM"))
VAR Result =
IF(
    lastdateslctn = selectedmonth,
    CALCULATE([Total Hours], ALLSELECTED('Working Hours Table'), 'Working Hours Table'[YEARMONTH] = selectedmonth -1 )
)
Return Result