Filter table at higher level of grain from a graph

Hello,

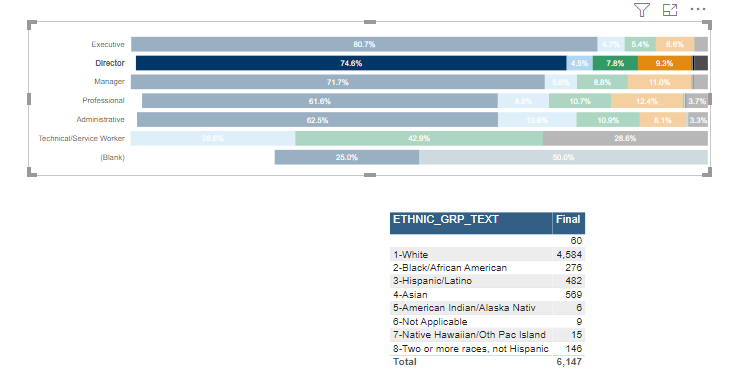
Is it possible to show the higher level data and not filter all the way through?

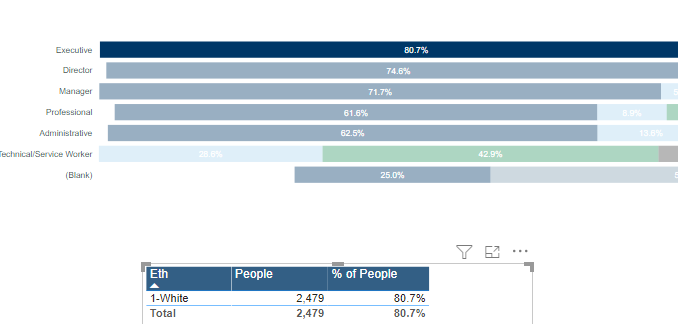
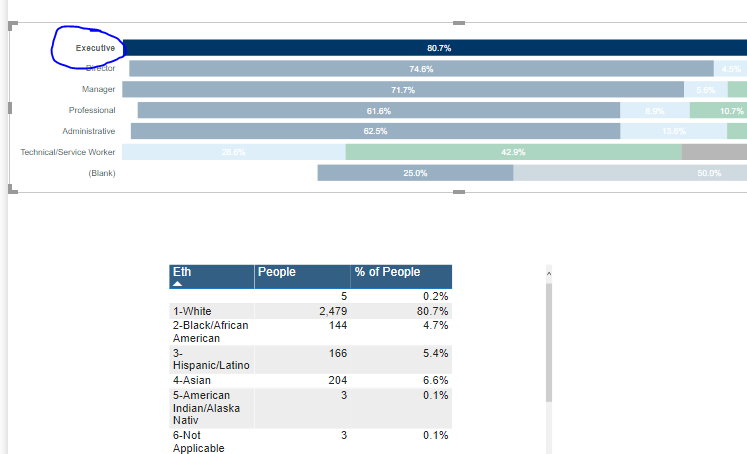
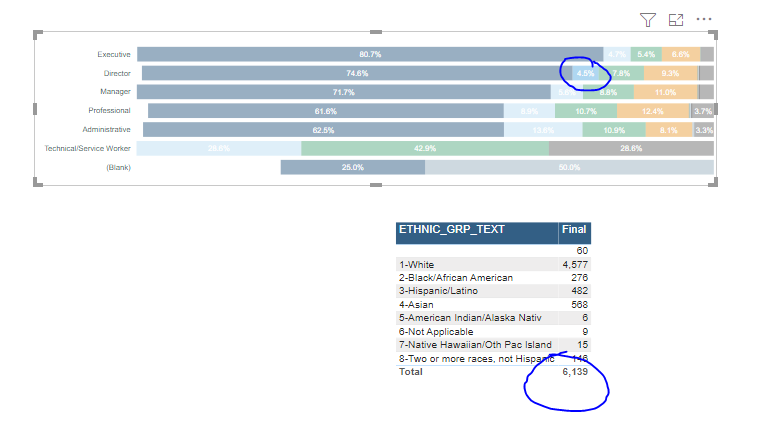
For e.g.: Here if someone clicks on the 80.7 in the graph, then in the table below instead of showing just that row, show everything (like in figure 2).

image

Figure 2:

Users don’t want to click on label, they want to click on the bar, but still want to see everything related to that Manager Level data.

Can we achieve this with DAX? I put in the sample file here:

https://drive.google.com/file/d/1RBMJfF5BVcxutHr-jCU7RgSP1IQEboxO/view?usp=sharing

Thanks. Please let me know if you have any questions.
RK

Hi @rit372002

Turn off interaction between visuals using Edit interactions

EditInteraction

No, that’s not the issue here. I know about “Edit Interactions”.

What I am looking for is: Even if you click on blue piece of the bar for Executive in the chart then showing “1-White” value for “Executive” in the table, I want to see all the ethnicities for Executive in the table.

If it helps, I posted this question on another forum and came close but that’s not the correct answer yet.

Thanks,
RK

Hi @rit372002

Got it… Is this what you are expecting…

20211110_224349

YES!!! Can you please share the solution. This is awesome! This is exactly what I am looking for. Thanks in advance.

@rit372002

Attached PBIX file.
Here the idea is create a disconnect table and measures

Community Executive Bar.pbix (28.6 MB)

2 Likes

Thanks @Rajesh. I will mark it as a solution but was just wondering what was the concept behind this and how this works? Anyways, thank you so much!

@Rajesh

I found one bug in it and banging my head to resolve it but not having any luck.

I click on “Director”, I see overall as 6147 (Correct)
I click on the blue bar (1-White), I see 6147 (Correct)

I click on 4.5% which is “2-Black…”.I see overall number changes to 6139.

There are external filters here on the page:

image

In my research, it has to do with this filter.

My question is: how do I incorporate these filters in your code and get the same value as 6147 or same total, regardless of what I click?

Thanks so much,
RK

nvm. I got it. Thanks!

@rit372002

What was the issue ?

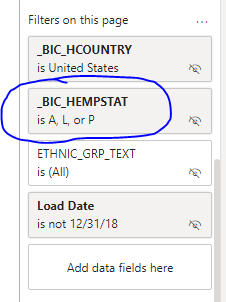
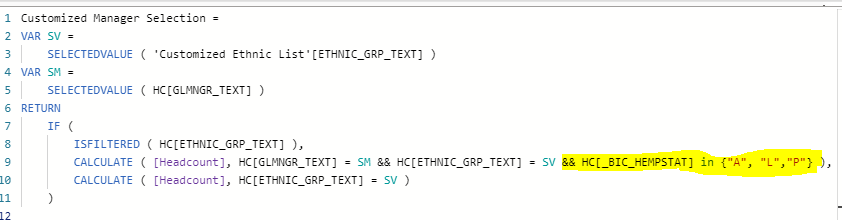
So I had filter in the filter pan as A,L,P as I described above. For some reason, I was not getting correct value when you were hovering on the smaller ethnicities. So I added this filter in the DAX code. I think it is called Context Transitioning? But I don’t know.

After adding it in DAX code, it works for all the scenarios. I hope it makes sense and thanks for your help!

Thanks,
RK