Filter Order in Visual

Hi,
This is driving me nuts. I’m recreating this visual from Sam’s tutorial:
Capture

And notice in the filter Sam has the filter showing in Non-alphabetical order:
image

But for me the filter shows in alphabetical order which means I cant order the items properly as they show on the Income Statement. What am I missing?

Thanks
Rob

@robH,

In the table containing your slicer values, you need to add a numeric column with the sort order you want the slicer values to appear in. Then select the column with the slicer values, click on “Sort by Column” in the ribbon and select your numeric sort column.

That should do the trick.

image

  • Brian

I believe I discuss it in this video

Just a matter of sorting by your template numbered rows as per Brian’s method above.

Thanks
Sam

Hi,
So I have done this already and when I show the data in the table it works- as it has the row index column in the table or matrix albeit hidden.

However in the bar chart that is bar chart above the row index isn’t used- and in the course I have done (Which has been excellent) This visual isn’t recreated!

Rob

@robH,

Can you please post your PBIX file? Will make it easier to figure out what’s going on and provide a solution.

Thanks.

  • Brian

@robH,

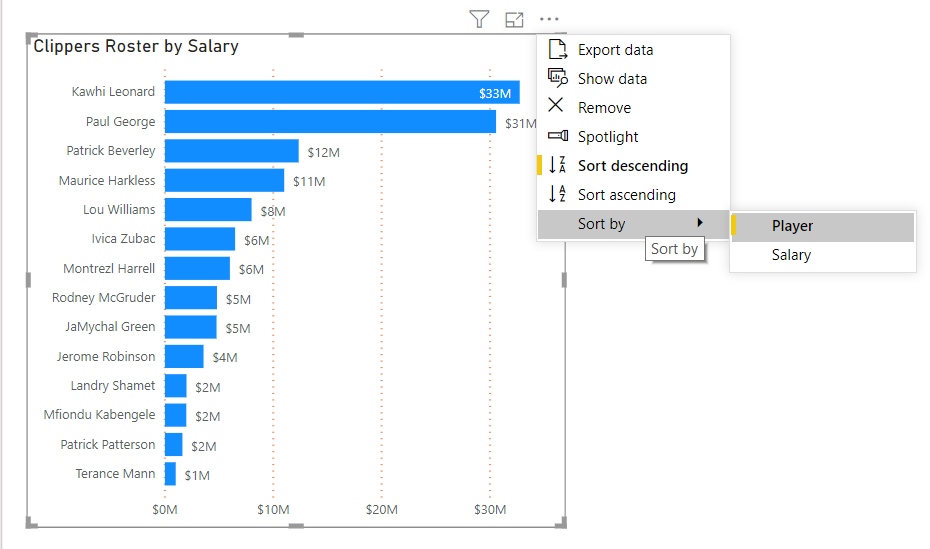
I’ve web scraped a simple example akin to your situation. In my example below, the only sort options in the visual are Player and Salary. But, suppose I want to sort the graph by Player Age?

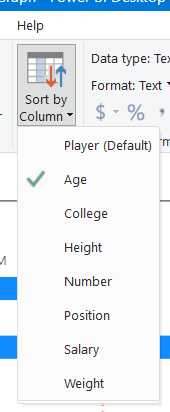
Using the technique above, define the sort order for Player using Age:

image

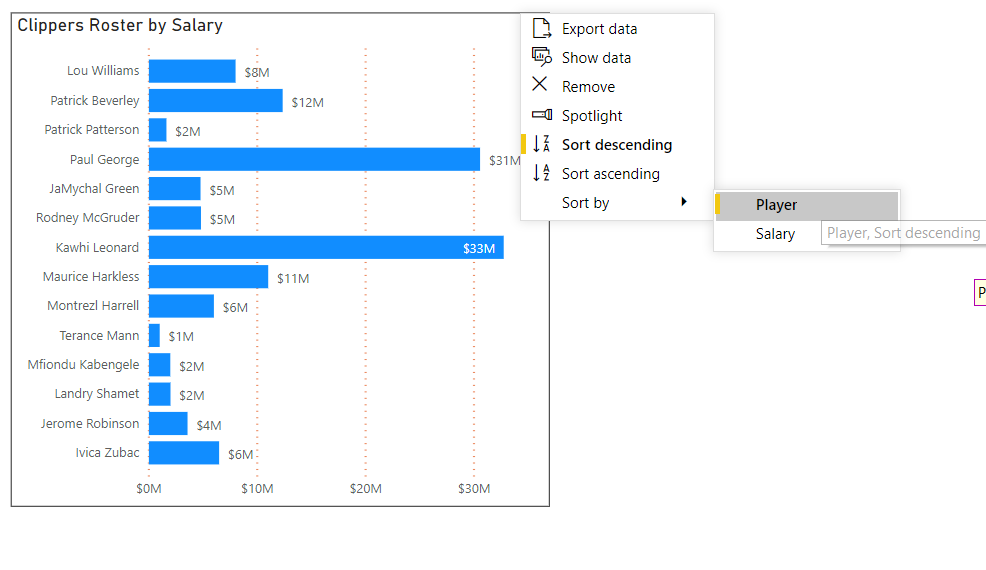
Now, when I sort the original graphic by Player, instead of sorting alphabetically as is the default, it will sort by Age:

Hope this is helpful.

  • Brian