I have a financial year filter that starts in July. I have a measure and I want to modify the filter context for this calculation that the financial year filter will starts in October rather than July.
Here’s my dax measure
    CALCULATE (
        [Total Sales (Journals)],
        FILTER ( Accounts, Accounts[Name] = "Fees - Permanent" )
    )

--name of financial year filter/slicer are FY24, FY23...
Hi @Keith, appreciate your quick response. I prefer not to make the adjustment directly on the date table, as this is specific to a particular measure. Is there a way to achieve this using DAX? Thanks!
not to my knowledge as your dax is based on your present fy date table. If i remember correctly there has been others that has asked that in the forum. Did you try searching or ask AI tool like (ChatGPT).?
If you need two different calendars and you don’t want to alter your date table to accommodate both you could create a second date table, a financial one, and use it when you need it. just follow @Keith’s note on creating that.
Answer: Hi @ronald_balza. Certainly, you can remove the original filter context and create a new list of date values beginning in October to be applied as a new filter context to the data model. However, this scenario prevents you from using the standard time intelligence functions. Also, the DAX code will become complex, hard to maintain and potentially render undesired results.
Let’s go through a different approach and provide the solution to your request.
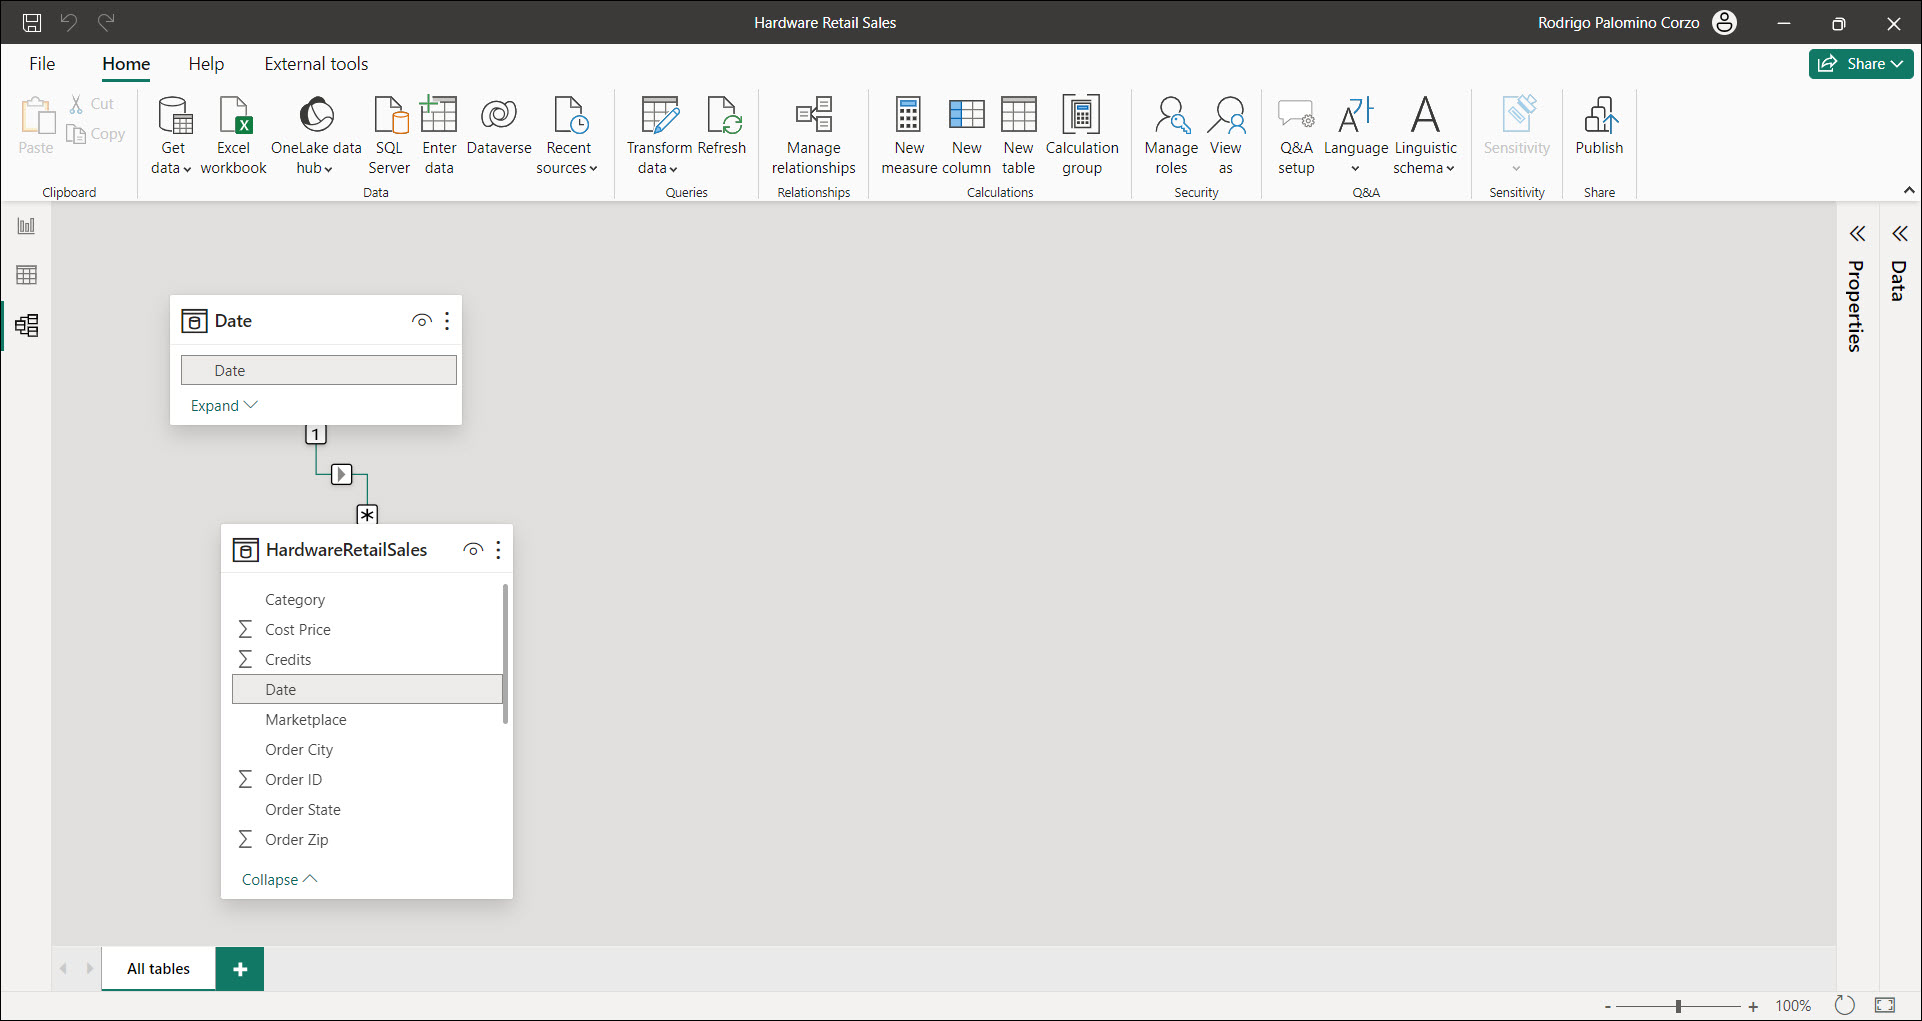
The Date table is marked as a date table and has a relationship with the HardwareRetailSales table. This setup is vital to simplify the use of time intelligence calculations.
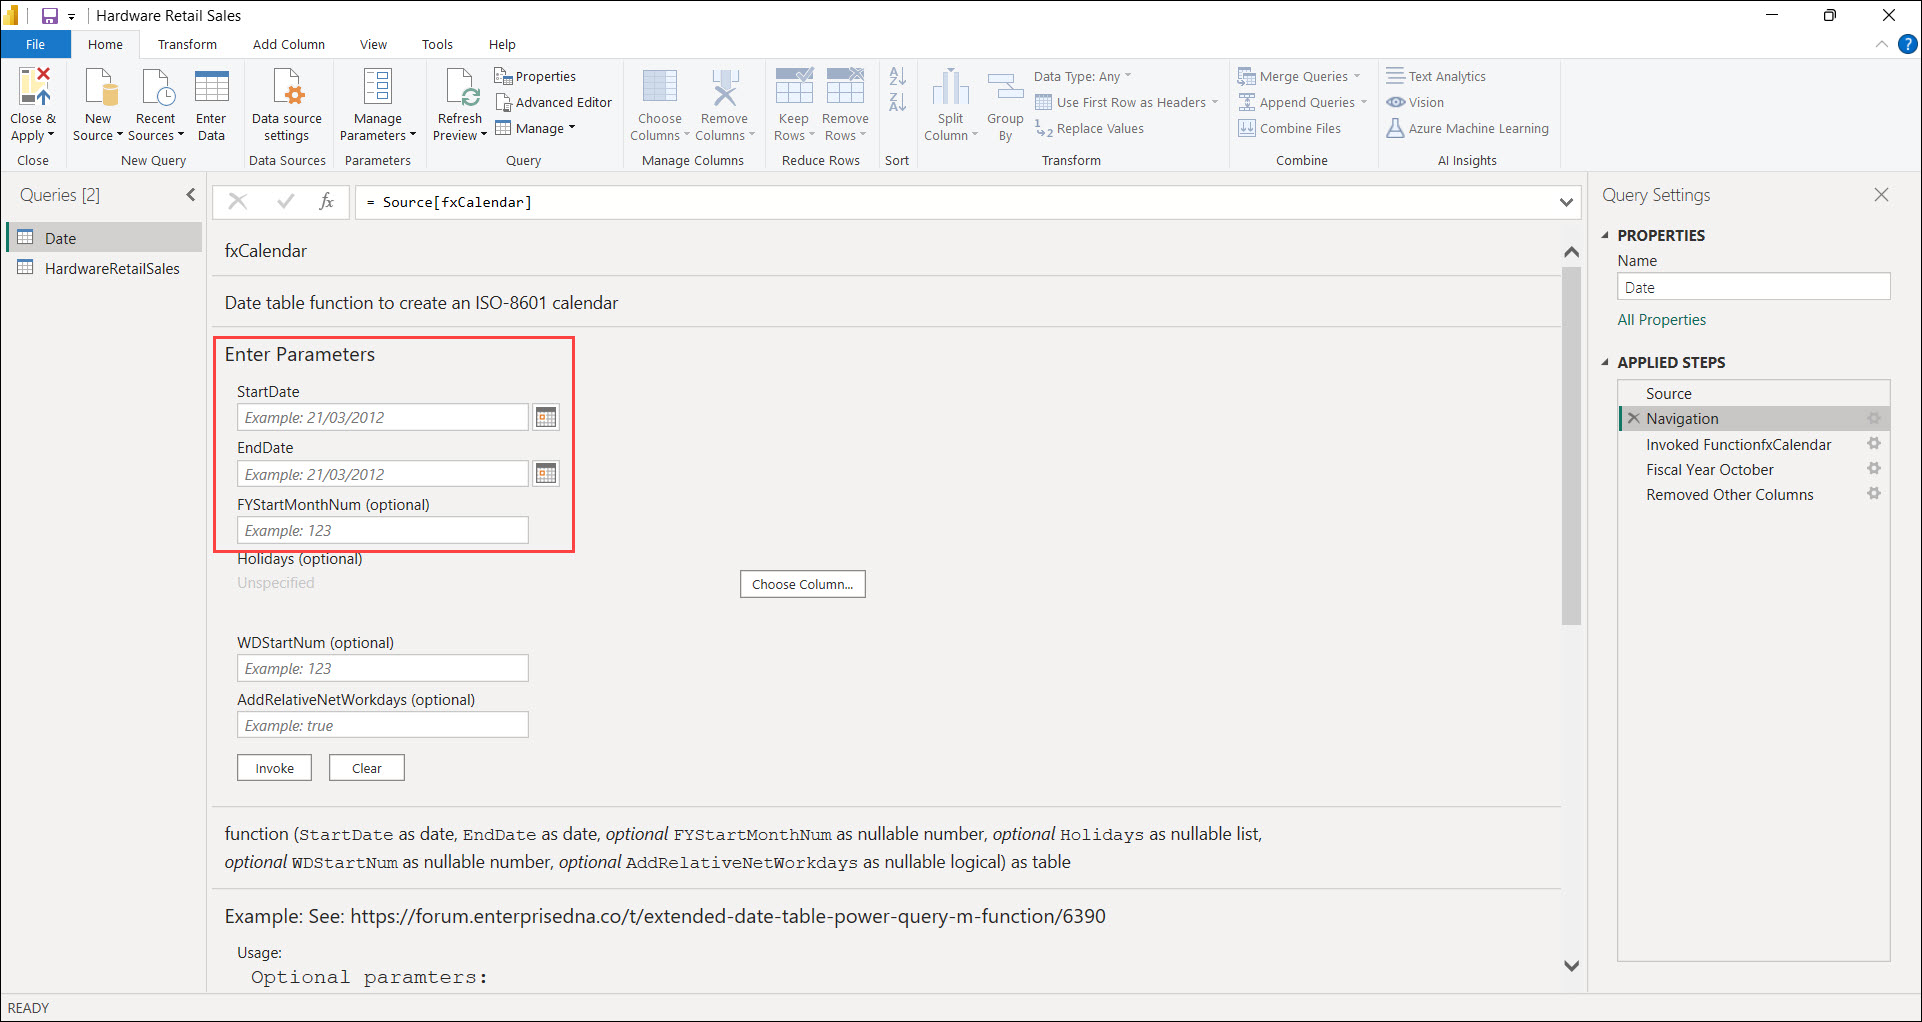
The Date table is built using a Power Query function. The function allows you to use an integer parameter to indicate the beginning of the financial year. For example, if you type 7, the calendar will create a new fiscal year for each value of July 1st. @Melissa has done a remarkable job in building the M script.
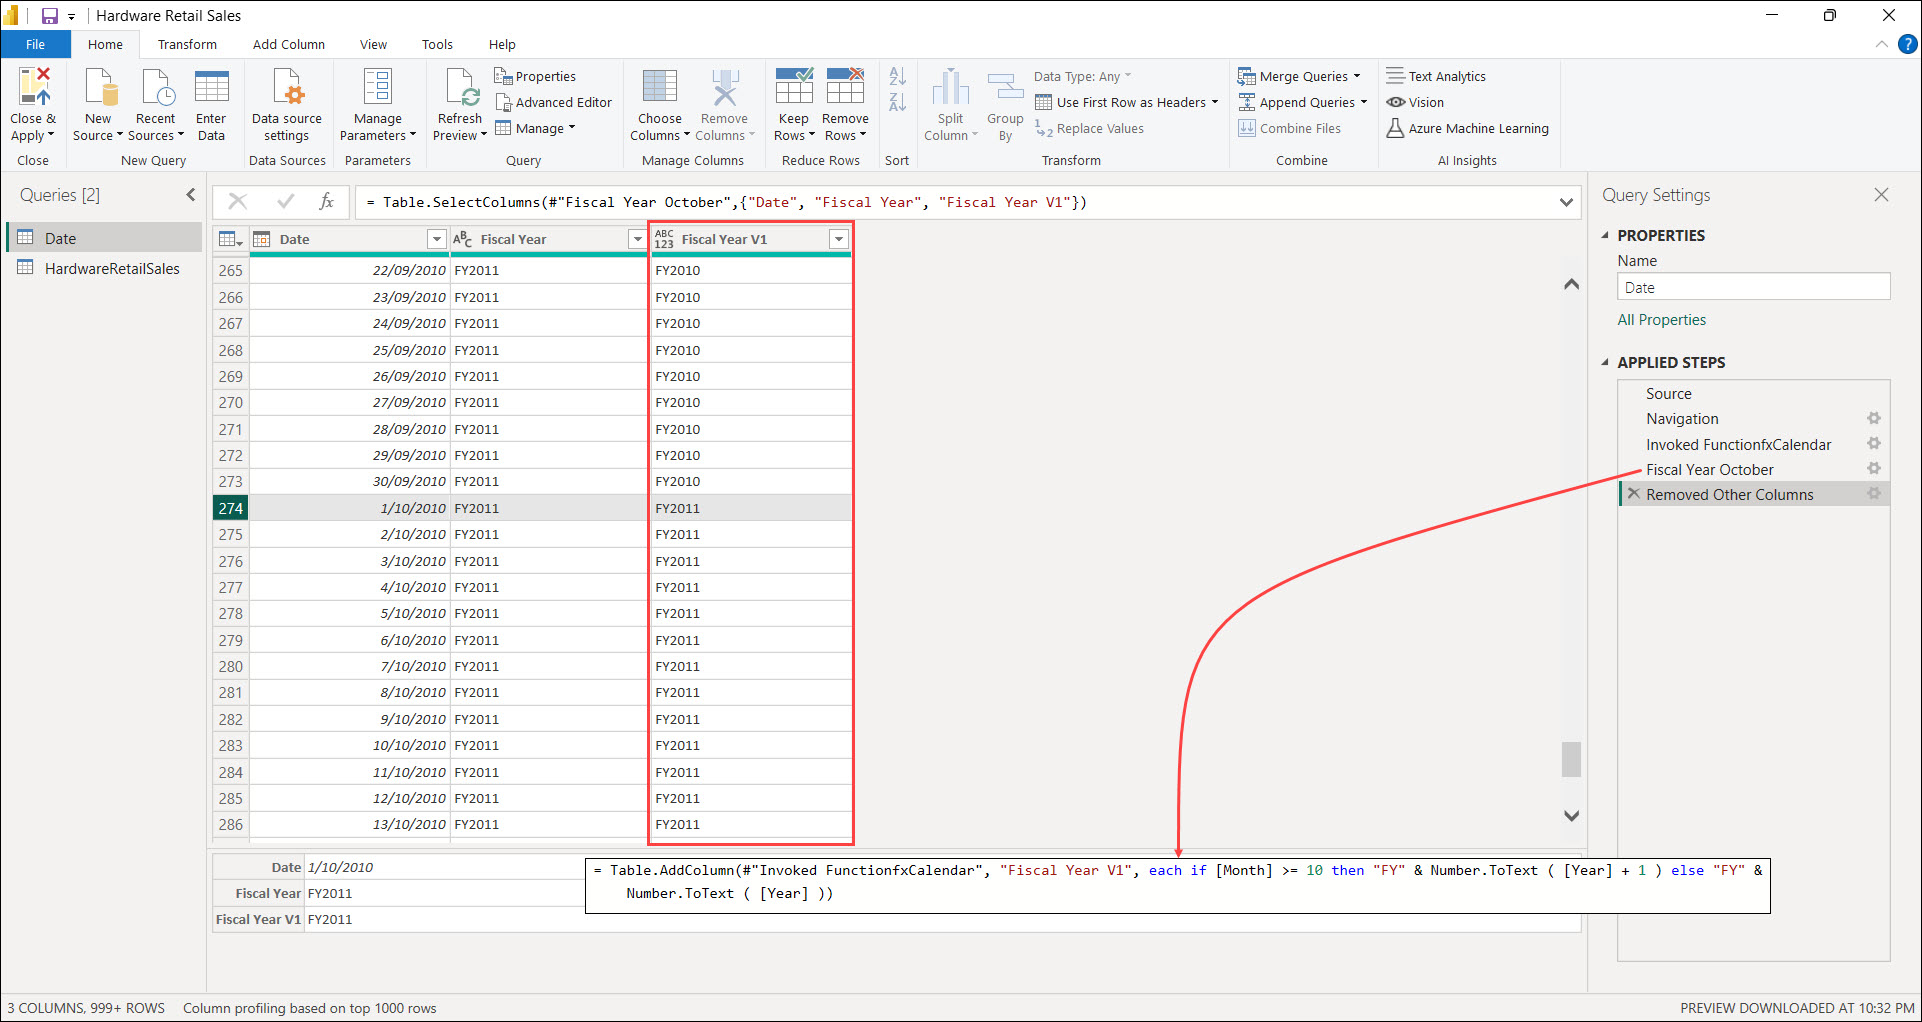
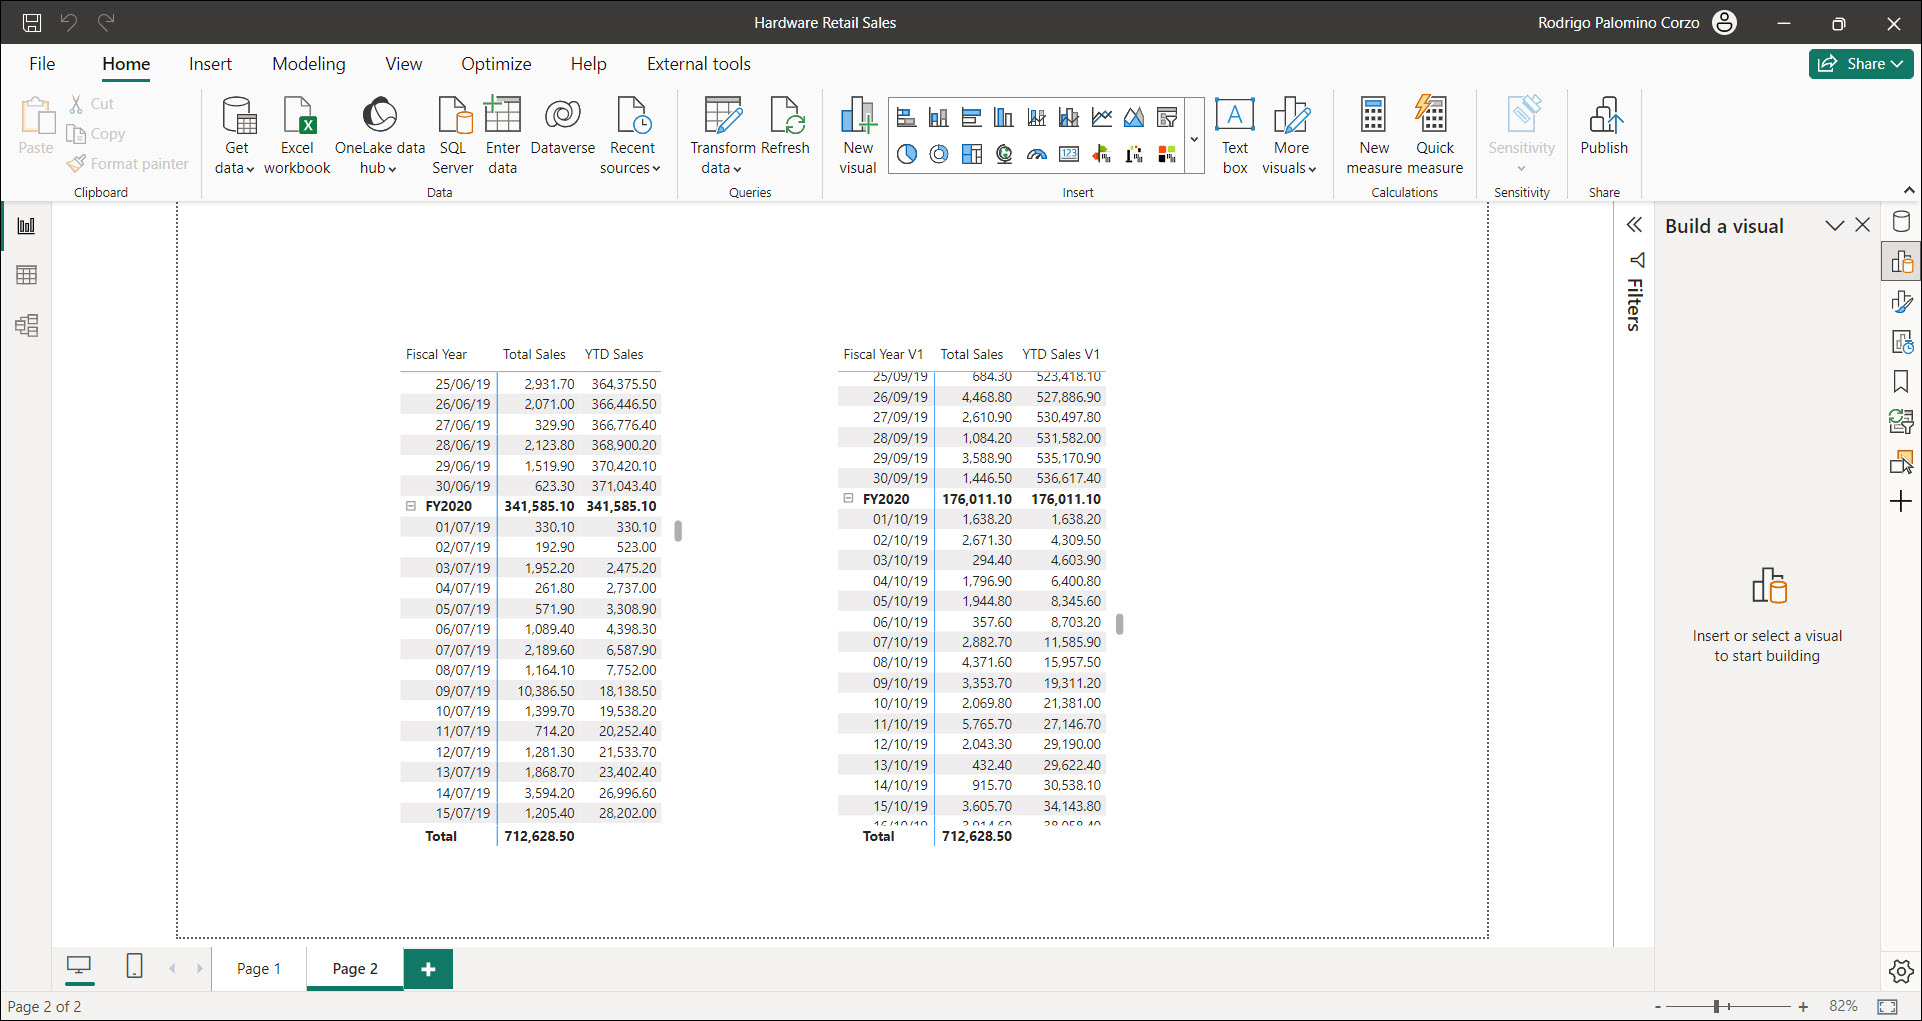
Look at the matrices using the fiscal year and date columns. The matrix on your right uses the new Fiscal Year V1 column, providing a new grouping or hierarchy for the date values. It also uses the YTD Sales V1 measure, cumulating sales amount from the 1st of October.
Leveraging the time intelligence functions by creating additional fiscal year columns in the Date table and their corresponding measures will keep your DAX code simple.
The biggest takeaway from this example is that when creating a solution, data modelling comes first; DAX is the last step.