So it is the same as the top 3 selling products in the current selected quarter, but show those products sales over all time (or over the last 5 quarters) in a chart.
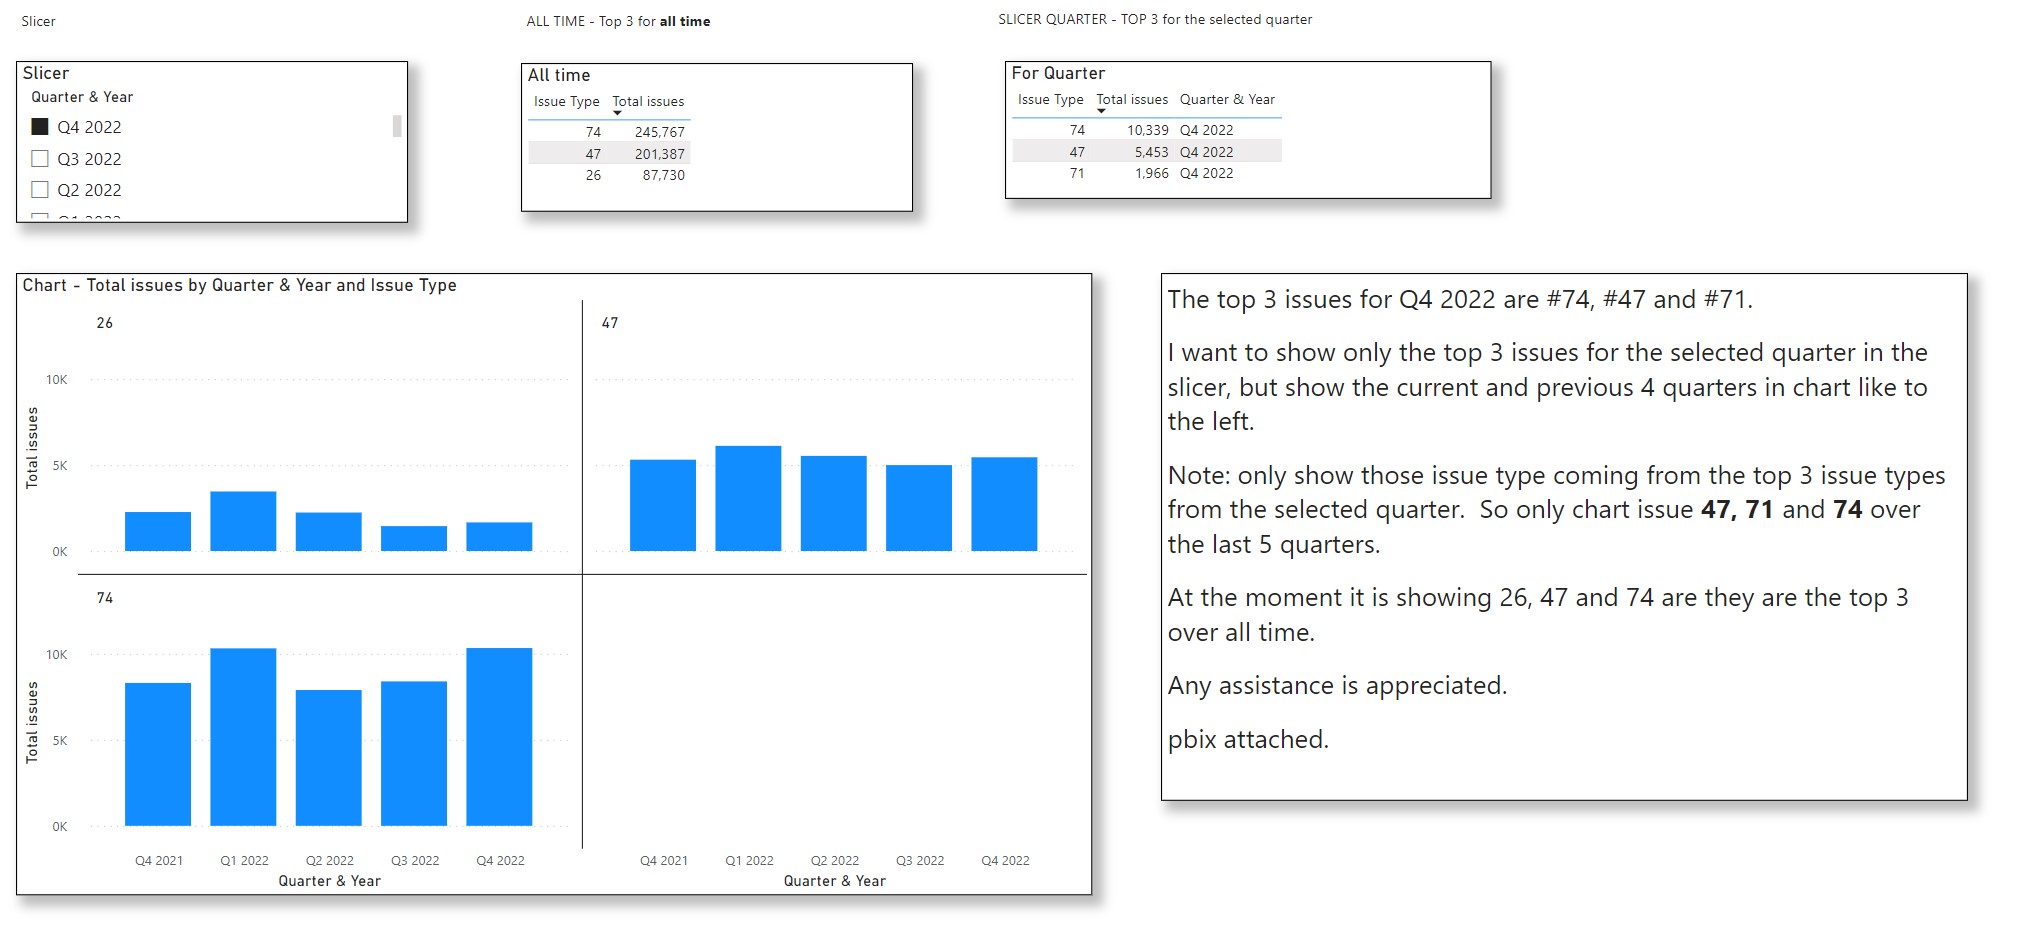
The top 3 issues (aka selling products) for Q4 2022 are #74, #47 and #71.
I want to show only the top 3 issues for the selected quarter in the slicer, but show the current and previous 4 quarters in chart like to the left.
Note: only show those issue type coming from the top 3 issue types from the selected quarter. So only chart issue 47, 71 and 74 over the last 5 quarters.
At the moment it is showing 26, 47 and 74 as they are the top 3 over all time.
Any assistance is appreciated.
pbix attached.
forum issues top 3 help.pbix (380.7 KB)