Hi All,
Background:
I have a dataset that consists of about 200 projects. For each project there are keywords accociated with it. The keywords are split into three different categories (age, datasource and language).
Dataset:
| ProjectTitle | Keyword - Datasource | Keyword - Age | Keyword - Language |
|---|---|---|---|
| Test1 | Other | Adult | English |
| Test1 | Other | Child | English |
| Test1 | Other | Adult | German |
| Test1 | Other | Child | German |
| Test1 | Register | Adult | English |
| Test1 | Register | Child | English |
| Test1 | Register | Adult | German |
| Test1 | Register | Child | German |
| Test2 | Wikipedia | Youth | English |
| Test2 | Wikipedia | Child | English |
| Test2 | Register | Youth | English |
| Test2 | Register | Child | English |
| Test2 | Wikipedia | Youth | Italian |
| Test2 | Wikipedia | Child | Italian |
| Test2 | Register | Youth | Italian |
| Test2 | Register | Child | Italian |
Desired outcome:
I want to have slicers for each keyword-category (Age, Datasource and Language), and then have a table/matrix that will show the projects that meets the exact criteria of the slicer selections. E.g. I want to be able to select several options from each slicer and only display the projects that meets all the criteria selected.
The problem:
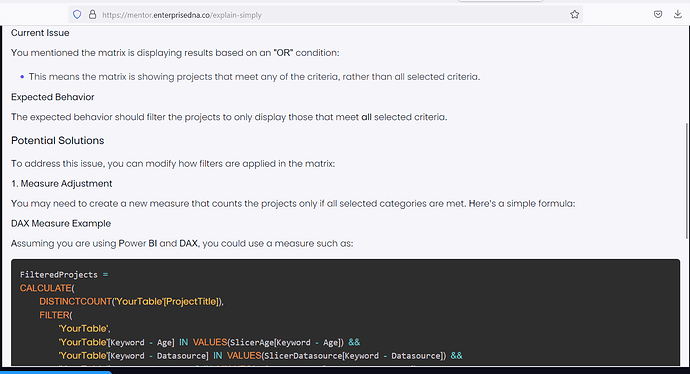
I am able to make a concatenate-measure that I can put in a matrix, but I cant get the matrix to do display what I want it to. E.g. If I select “Child, Youth, and Register”, the matrix should only show the “Test2”-project, however, it shows Test1 as well. I guess the reason for that is that it based on an “OR” statement rather than “AND”. I.e. it checks off for Child or Youth and Register, and not Child AND Youth and Register.
I have a attached a pbix-file that shows a mockup of my real data.
I’ve tried to find solutions to this in various forums but I cant seem to find the answer I need.
Does anyone here have a solution to this (simple?) problem?
Problem.pbix (22.3 KB)
Cheers all.
