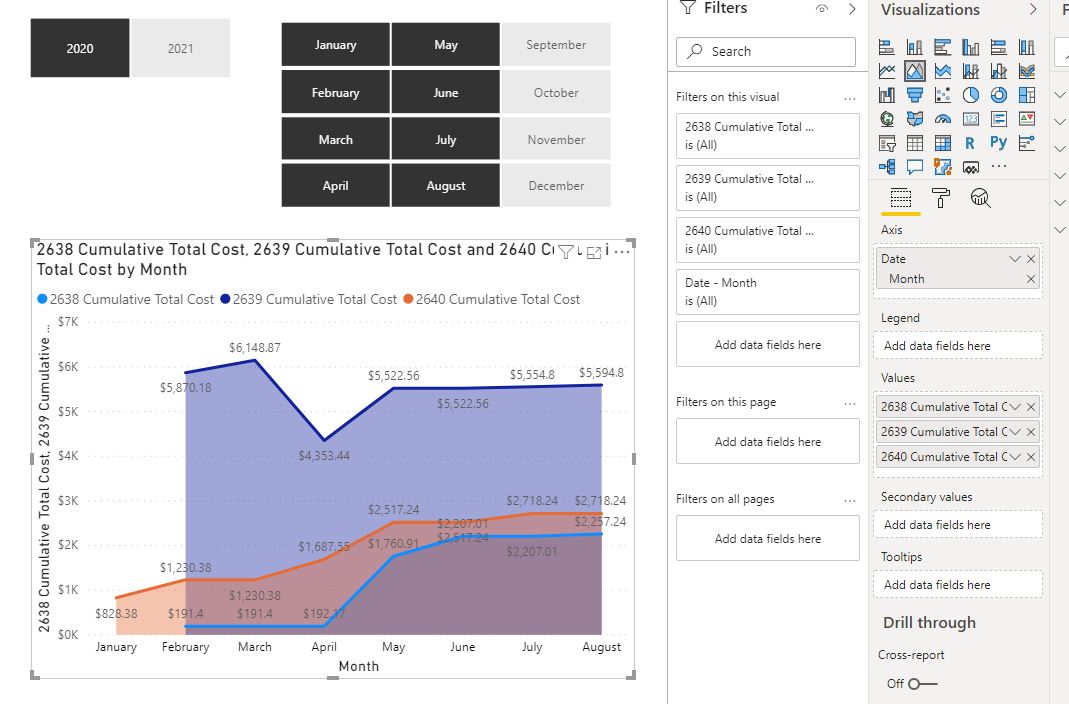
I wondering if there is a better way to use calculate with a filter. The goal that I have accomplished is to show cumulative totals for 3 pieces of equipment in a visual. Works fine but my approach is somewhat limited to my Measure. Below is one of my measures, it works based on a specific serial number.
2638 Cumulative Total Cost = CALCULATE([Total Cost],FILTER(ALL(Dates), Dates[Date] <= MAX(Dates[Date])),Equipment[Serial No.] = “GEX230-2638-9655KF”)
I have attached my visual. This works fine if I stick with the specific serial numbers I have in the three different measures.
Below is my original Measure
Cumulative Total Cost = CALCULATE([Total Cost],FILTER(ALLSELECTED(Dates), Dates[Date] <= MAX(Dates[Date])))
This works as well but, when I choose to display more than 1 serial number the visual aggregates all the values into one as shown in my visual below.
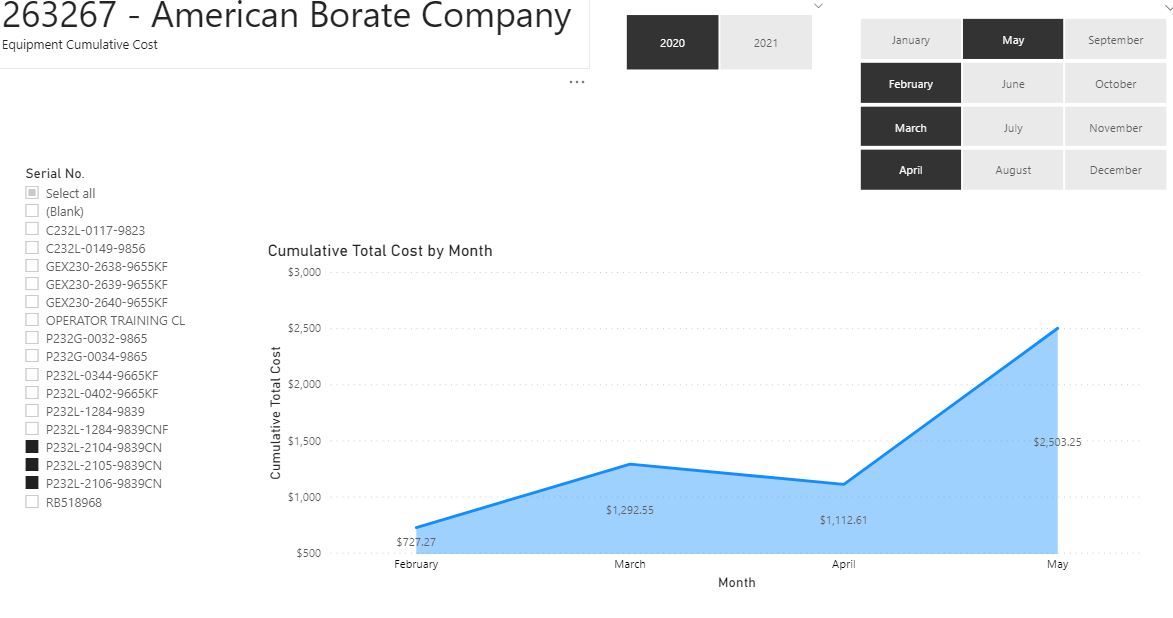
My question is this, is there a way to select multiple serial numbers and have the visual display the chosen serial numbers as displayed in my first visual? I am looking to see if I can get away from hardcoding the serial numbers.