In the attached PBIX there are two fact tables and a date table
• Defects ( all the defects for all the transport numbers )
• Tranportnumbers V260 ( all the tranport numbers these should be unique numbers and this already a filtered result from another table)
The table defects V260 is a first filtering from the defects table.
The problem is I need another filter to get the latest date from the CloseDateTime column ( this should result in a table with unique Transport numbers )
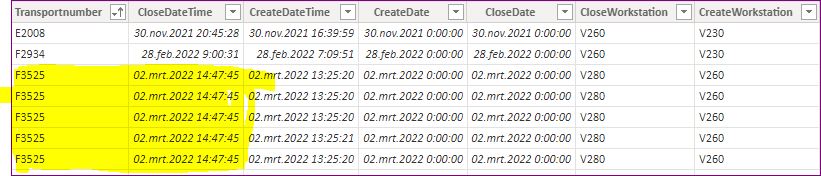
The screen shot ( attached ) shows the transportnumber F3525 with 5 defects with the same date/time and I need only one row for each tranportnumber
When this problem is solved I should have a table with unique transport numbers in the defects V260 table
Next I have to look up the “completedon” date from the transportnumbers V 260 table
If this date is before the CloseDateTi defects.pbix (1.7 MB)
me then 1 ( count the transportnumber )
Else 0
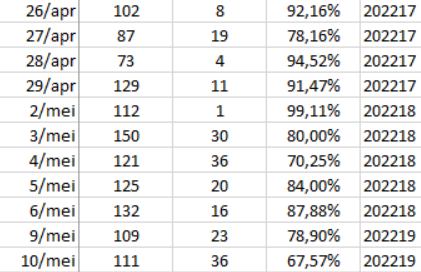
Visual report a table for the last 8 weeks for the number of defects
The measure is divide (number of defects – number of transportnumber) ; number of transportnumber
@Roger I will try to help you. Can I have a little bit more context?
The columns ClosedDateTime and CompletedOn are currently of datatype timestamp, but you only talk about the “latest date”. Is the time also important or can that be ignored?
Am I correct in my understanding that your goal is to get a KPI that shows a percentage of transport numbers that have been completed without defect. In addition to that you would like to have a table that shows the number of defects of completed transport numbers by day for the previous 8 weeks.
(btw, I replied to your 8-weeks challenge in another post).
Indeed I was unclear, the format is date/time and it is important for the check.
the goal is exactly what you pointed . a KPI as a % of the defects over the transportnumbers.
and thanks for the solutions of the 8 weeks.
there is also an interesting video from Melissa explaining an dynamic calendar getting the start and end date from a order fact table
This video has helped me a lot with data transformations at my current workplace. I think this video can help you for part 1 of your problem that I quoted above.
You would need to go to power query editor and follow her instructions for group by and editing the M code.
If this helps with part 1 of your problem, let me know and we can work on the last 2 parts.
I’m trying to understand it correctly. Sorry to ask for continuous clarification.
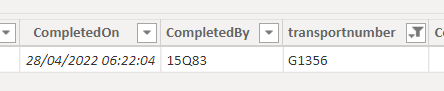
This transport number G1356:
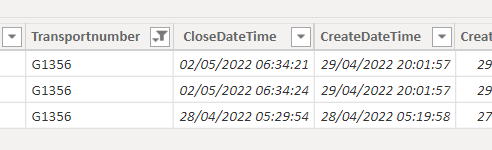
Has these in the Defect table:
When you report shows as Date 28April2022 it would show transportnumber G1356, because it was completed on that day. Would it show as a defective transportnumber? I’m asking as at the timestamp of completion there were no defects.
i this case we should ignore the date from 28/4 because there are defets on a later date/time
if these are all the defects from that transportnumber then the latest (the closest to today’s date ) is the one to count. That date has to be compared with the completedon date/time from the other table in case it is later then this date the transportnumber is NOK I tried the calculated colum see screenshot and this seems to work
Have you tried transforming the defect table in power query mode? I think it would help to transform the table to only contain the latest defect by Transportnumber. The video I posted earlier makes it really simple to do so.
I have attached my solution (NOTE: with my understanding of your business logic).
A few remarks:
In my solution there is no need to create an additional table (with either DAX or Power Query).
Currently I’m using the “Completed on as date” to filter the report page. This should ideally be done with the “Datetable”. However, currently I suspect the datatype of the column “Completed on as date” is Timestamp. The datatype of the “Date” in the “Datetable” is of datatype Date. As a result the Date table cannot filter the “Transportnumber V260” table. My advice would be to change the datatype of “Completed on as date” from Timestamp to Date. Then you can use the “Datetable” to filter the report (and also to implement the 8-weeks solution)
Look at my datamodel on review how I think the tables should be related to eachother. Again, I have ignored the additional table that you created.
Siantar
thank you very much for your pbix file, the solutions looks so simple.
For reason of simplifying the model I added the two V260 tables.
Ideally this should be virtual tables ( see attached excel sheet ) in a measure so I don’t need to fill my model with unwanted tables.
the timestamp is not an issue, i can solve that in my query before loading the data.
there is a screenshot in the excel file showing how it should look.
because the report is on a weekly basis “YYWW” I didn’t know how to link to the datetable because the “YYWW” column has no unique values.
Further the calendar is from 01/01/2021 – 12/31/2025; how to filter the last 8 weeks with data? I saw a video from Melissa that can help me " dynamic start and end date in a calendar table"
because of the the switch to the summer time I had to add 1 u before loading the data. Are you aware of a dynamic solution for this problem?
when using the summarize() can i report on the defects faults and components as shown in the screenshot?
I will start with your measure and see how far I get. I have no clue how the retrieve a value from a var virtual table
thanks again in advance
Roger measures for Siantar .xlsx (15.3 KB)
I do not see the need for virtual tables. Your two sources “Defectenlijst” and “Operationscomplete” sufficient for your data model.
Good!
I don’t see it in the Excel sheet
I had assumed that when you report on dates it would be the completion data of V260. If so, just connect your date table to the Operationscomplete table through the date.
To get the last 8 weeks of data in your report, I have already shared with you a solution via the offset method in another post. Dynamic start and end date is a different topic and not related to this.
I’m not understanding the issue here. The timestamps comes form the system. Surely that system has the correct summer or wintertime.
The SUMMARIZE() function delivers a temporary table. A measure in a report cannot return a table, it always has to be a value. A DAX function can return a table as you have done so previously. (although as said before, I don’t think it’s necessary).
Lots of questions, lots of answers. Hope it helps. If you have any further questions, please open another topic as this topic has been set to resolved by yourself already.
if I use the sources defectenlijst table and operationscomplete, I have to add filter(s) to the summarize measure you created in your PBIXfile?
thanks in advance
roger