Filter a Slicer by a Measure

Hi–I have been working on this for SEVERAL weeks now, and not getting everything working like I would like for it to.

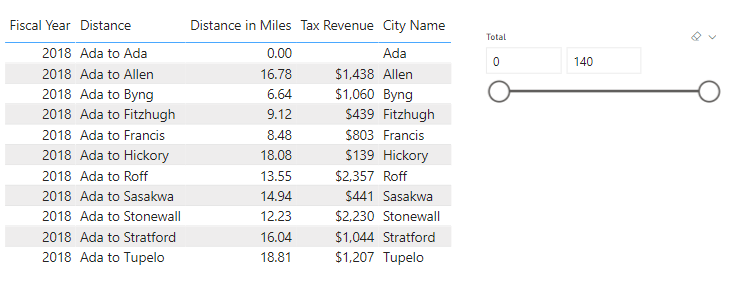
Basically, I have a table like this.

You select a city from the City Name Slicer-this is the city you want to compare, then select the Fiscal Year and the Mile Radius from the City.

What I am wanting to do is to filter the table for Tax Revenue that is included in the table–in this example, I want a slicer to show between $137 and $16,812,407.

I have watched the video by Parker with BI Elite multiple times. Filter by a Measure in a Slicer.

In this video, Parker creates 3 items.
1)generate series with to create a table from 0 to the max value of his Total Sales measure.
2)creates a Measure Filter to filter the table
3)Creates a Slicer Filter to filter the Slicer

This works up to a point. In the video, Parker has Date and Sales values. In my table, I have many more columns.

When I do the generate series, I use the following

Tax Revenue Number Filter = GENERATESERIES(0, [Tax Revenue], 10000 )

In this, the generate series is creating values across the ENTIRE dataset-which includes multiple cities and multiple years and their tax revenues, which is way too large.

So the first question–how do I limit the generate series formula to only generate the series based on my selections?

I then created a Measure Filter–this appears to be working

Tax Revenue Measure Filter = 
VAR MinValue = min('Tax Revenue Number Filter'[Value])
VAR MaxValue = Max('Tax Revenue Number Filter'[Value])
VAR CurrentMeasureValue = [Tax Revenue]
RETURN
If(CurrentMeasureValue >= MinValue && CurrentMeasureValue <= MaxValue,1,0)

When I try to create the measure for the Slicer Filter, I am unable to summarize all the columns of my table. The column that I am having problem with is the one coming from the Tbl1City column for the City Name. This is the measure as I have it so far.

Tax Revenue Slicer Filter = 
VAR Virtual = 
SUMMARIZE(
   
    dDate[Fiscal Year],
   "Distance",[Distance],
   "Distance from city",[Distance],
   "Dist In Miles", [Distance in Miles],
    "Tax Revenue", [Tax Revenue]
)
VAR MinValue = MINX(Virtual,[Tax Revenue])
VAR MaxValue = MAXX(Virtual,[Tax Revenue])
Var CurrentSlicerValue = SELECTEDVALUE('Tax Revenue Number Filter'[Value])
RETURN
if(CurrentSlicerValue >= MinValue && CurrentSlicerValue <= MaxValue, 1, 0)

I am not able to get this slicer filter to work at all. When put in the filter section of the slicer and say is = to 1, it doesn’t filter the slicer or the table.

Any suggestions would be appreciated. I am not a programmer, so I know that there may be issues with some of my tables. If you have suggestions on how I can fix them to work better, I am open to that as well.
Thank you all in advance for your time.
My File is attached. This is just a demo file, so there are other items that do not apply.

#Filter a Slicer by a Measure
Filter a Measure by a Slicer.pbix (18.6 MB)

#Dax

First, the bad news. Currently, it is not possible to dynamically input values from measures or visualization/table contextual filters into Numeric Range Slicer.

The following considerations and limitations apply to the numeric range slicer:

  • The numeric range slicer filters every underlying row in the data, not any aggregated value. For example, let’s say that you use a Sales Amount field. The slicer then filters each transaction based on the sales amount, not the sum of the sales amount for each data point of a visual.
  • It doesn’t currently work with measures.
  • You can type any number into a numeric slicer, even if it is outside the range of values in the underlying column. This option lets you set up filters if you know the data may change in future.
  • The date range slicer allows for any date values even if they do not exist in the underlying date column.

Source:

Now to end this on a slightly positive note:
I was able to get the numerical slicer to interact with the table when I used Total column from CitySalesTaxCollections table. However, as listed above, instead of aggregated values, the slicer is filtering by each row in Total Column. If it is possible to replicate the City to City Table in Power Query using Groupby or Self Merge (I know you can achieve this using Alteryx, so I am assuming it should be possible using Power Query), you could use the aggregated total column for Tax Revenue as the input for Numerical Slicer which will still not give you control over the range but the filter will interact with the table at the aggregate level rather than row level. Again, I know this is a long shot but it seems to me like the only one that might provide you the interactivity you are looking for.

1 Like

Thank you so much for responding. Can you please send me your file so I can see what you are doing? In the picture, the range is 0-140, but the list shows cities with more tax revenue. I have to step out for a while. I do have something that “works”, but not like I would like–let me get that ready and I will upload it and you can see. What I really want is for the slicer to show only the range that is displayed.

Yes, you are right in your observation. The reason for this behavior is because the numerical slicer does not consider the aggregated value from the measure (as it does not accept measures). I have used the Total Column and the slicer applies the between filter to each row of the column rather than the aggregated value. Hence, you will have to create a table in Power Query (or DAX) with a column showing the aggregated Revenue value for each City by City. If you use this column in your slicer then the table in your visualization will interact with this slicer and respond to the filters applied on the slicer. However, there is no way for you to control the range that appears on the slicer as it does not take in a measure as input but column values.

Filter a Measure by a Slicer-Edited-PG.pbix (18.0 MB)

1 Like

Thank you–
I have attached a file where I show a “working” model, the only problem with this is that the generate series is not dynamic. Right now, I put the max number at 750,000,000–this is larger than the largest city’s sales tax for a fiscal year, so unless it grows more than this, it should accommodate the number. Also, on the measure filter–I did some edits and on the slicer filter, you can manually enter numbers to narrow the data, but the range will not automatically update to accommodate the range of what is displayed.

In Parker’s example, it would–but I was not able to solve the issue of getting the value of the Tax Revenue to represent the aggregate value per city for each fiscal year–it was showing the maximum value of the entire table. If this had worked, I think I could have achieved what he did in the video.

Thank you for all your help.

Filter a Slicer by a Measure.pbix (17.7 MB)

Hi @tjohnson! We noticed that your inquiry was left unsolved for quite some time now.

Looks like your inquiry was out of the experts and users’ bounds.

We strive to answer ALL inquiries in the forum. However, if you are sure that you provided all pertinent context to your concerns and read how to use the forum more effectively and still find your question unanswered, you can check out tutorials to learn this yourself as your membership also comes with relevant resources that may help you with your Power BI education.

While our users and experts do as much as reasonable to help you with your inquiries, not all concerns can be attended to especially if there are some learnings to be done. Thank you!