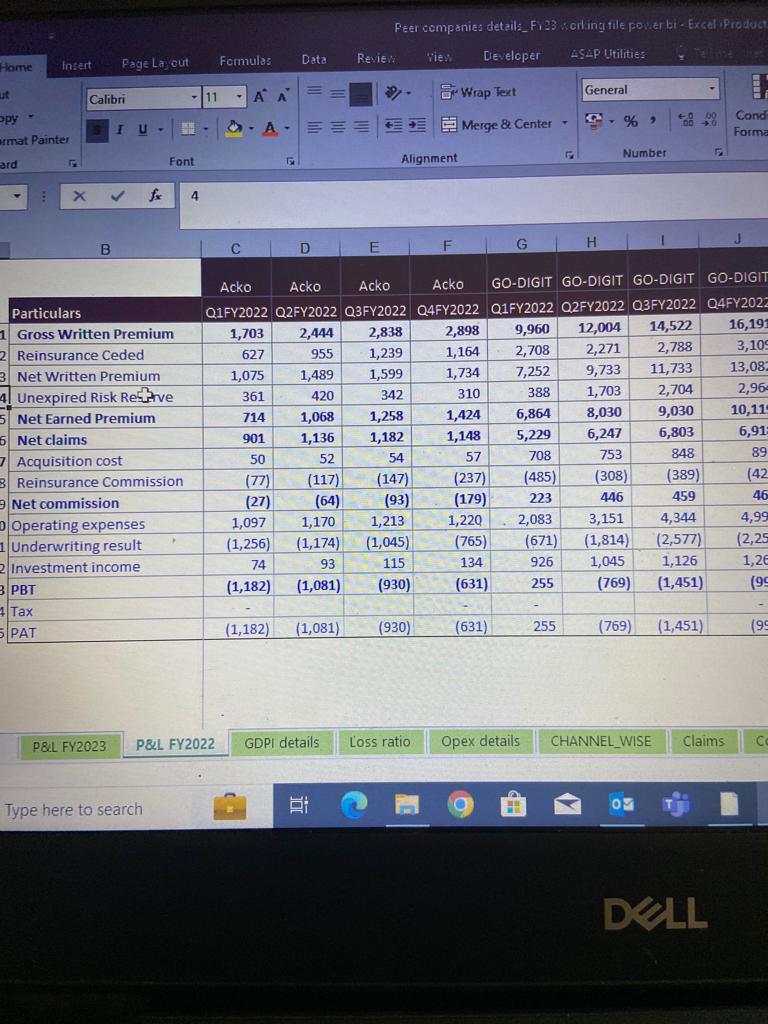
I am preparing a Power PI report where i want to Show Quarterly Financial Results of the organisations.
So there are multiple companies.
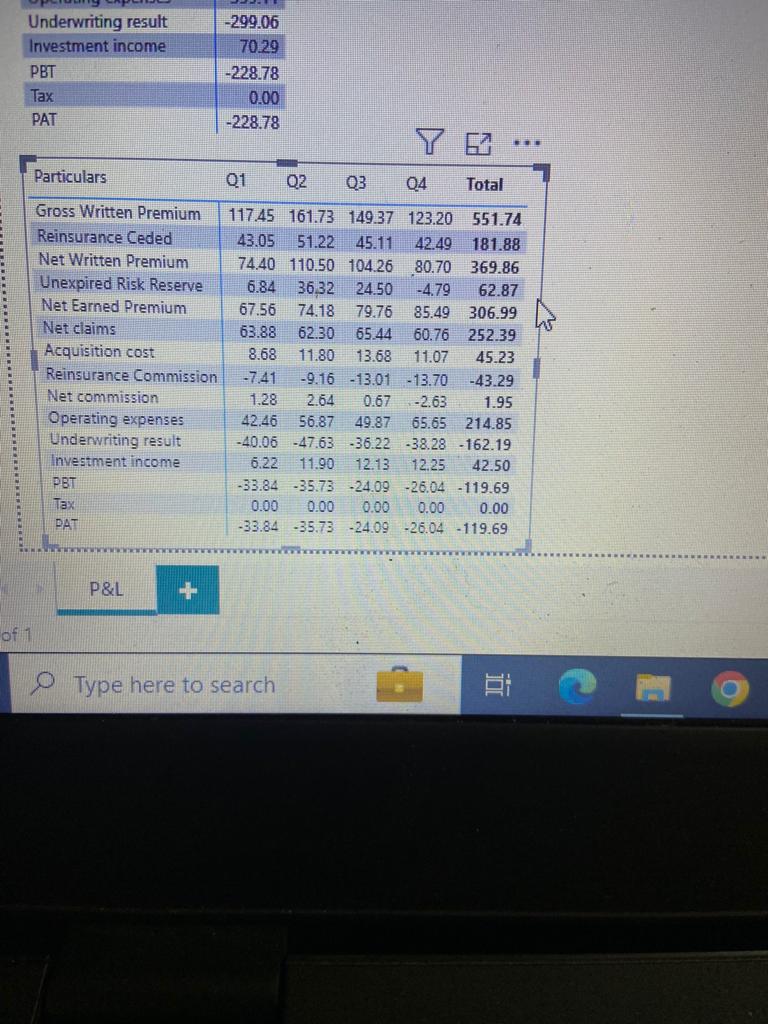
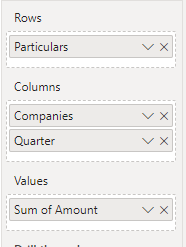
In Matrix Visualization, i want to show quarterly report company wise.
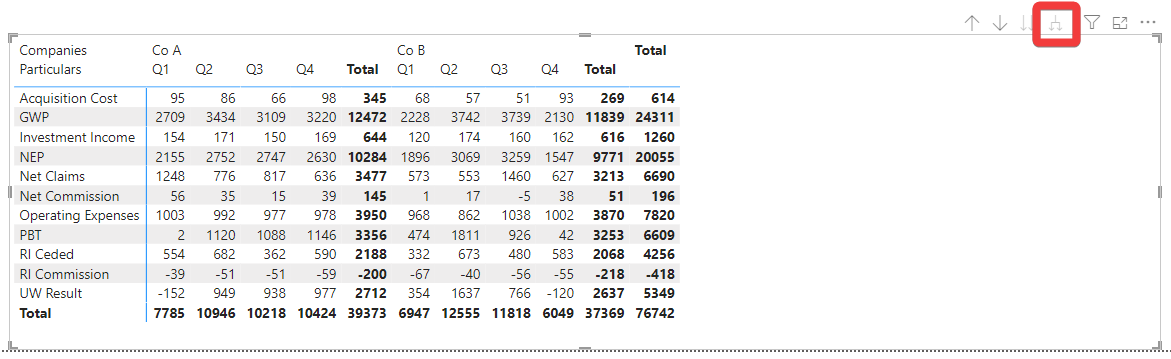
For eg. If i select Company 1 & 2, then the result should be
Company 1 - Q1 Q2 Q3 Q4
Company 2 - Q1 Q2 Q3 Q4.
But currently, when i select 2 companies, it is summing up both of them instead of showing them seperately.
How do i solve this problem??
Please find the attached Excel file & Power BI File.
You need to add more information, also part the rules of the forum that we don’t address to anyone in specific in the room. By addressing it to a person, it will discourage others in helping you.
Please provide your power bi file and what is the expect outcome/output you are requiring.
Did you try adding a filter/slicer to your page? (so you can select the company that you want.)
Welcome @iamvaibhav020! At the Community Forum, it’s common for our users to prepare their business confidential Power BI Desktop and Data Files when submitting a question. It’s a recommended practice that we support. To help you understand the patterns and logic behind their usage, we offer a number of channels of learning resources and best practice examples available. Our volunteers are happy to provide guidance related to logic, but they do not offer design services. Please note that their assistance is provided on a best-effort basis, and no service level expectations are implied.
For a deeper level of assistance beyond what we have offered thus far, we would require a work-in-progress Power BI Desktop File, a source file in Excel format using Tables, and any code or DAX measures added that should be formatted. This is similar to other Forums such as Microsoft Community and Reddit. Thank you.