Excluding Customers for certain date range

Hi everyone,

I’m trying to make an adjustment in one of my reports to account for some process changes we made after a certain date. Basically exclude a certain customer’s results after a certain date.

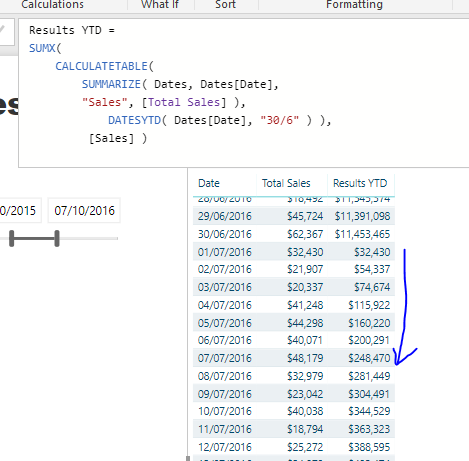
So I have my basic measure:

    Assignment Accuracy =
CALCULATE ( DIVIDE ( [Sum Ctrs Passed], [Assignments], 0 ) )

And I want to calculate the weekly results prior to (and including) 04/03/2018, which I’m doing here:

Assignment Accuracy Before 04/03/18 = 
CALCULATE (
    [Assignment Accuracy],
    FILTER ( Dates, Dates[DateKey] <= DATE ( 2018, 03, 04 ) )
)

Then I want to calculate the results from the basic measure after 04/03/18, but exclude a customer:

Assignment Accuracy After 04/03/18 = 
CALCULATE (
    [Assignment Accuracy],
    FILTER ( Dates, Dates[DateKey] > DATE ( 2018, 03, 04 )),Customer[Customer Code] <> "EXAMPLE")

Both of which seem to work okay.

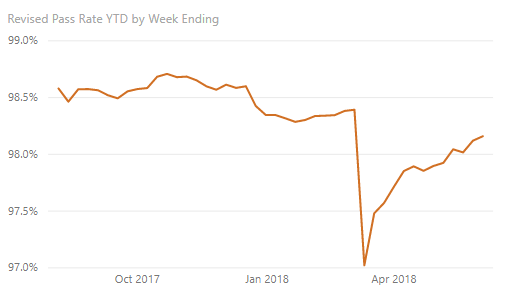
It’s when I try to combine them back into a single measure that I run into trouble - i.e. the values for after 04/03/18 all return blank:

Assignment Accuracy Revised =
VAR SelectedDate =
    SELECTEDVALUE ( Dates[DateKey], BLANK () )
RETURN
    SWITCH (
        TRUE (),
        SelectedDate <= DATE ( 2018, 03, 04 ), [Assignment Accuracy Before 04/03/18],
        SelectedDate > DATE ( 2018, 03, 04 ), [Assignment Accuracy After 04/03/18],
        BLANK ()
    )

I’m not using the [DateKey] value as the context, rather the Year&Week Number, but should that matter? I only have one date value per week coming from my fact table. Side note - it seems to work OK if I use the most granular dates - but this isn’t ideal for the end user.

Any ideas?

Side note around posting formula into forum - https://forum.enterprisedna.co/t/how-place-dax-formula-into-forum-topics-posts/156/3

Hey Sam,

Thanks - I swear I did that when I posted initially.

Hey Chris, no worries, sometimes the forum can play up I know.

Regarding this…

Why do you have the CALCULATE around here? I don’t think this is doing anything here.

For the bottom one

I’m not using the [DateKey] value as the context, rather the Year&Week Number, but should that matter?

Yes this will matter, because this is likely always evaluating to blank because you’re only selecting a Year&Week, so there’s no date here.

VAR SelectedDate =
SELECTEDVALUE ( Dates[DateKey], BLANK () )

Maybe you want to use MIN(Dates[DateKey] ) instead…or MAX

Also test out having the slicer as a date and see if that works. I’m sure it will, everything else looks fine to me.

Chrs
Sam

Hi Sam!

I think I tried playing around with some logic at the top end to see if it would make a change, but forgot to take the CALCULATE statement out afterward. No need for extra processing!

So I have replaced the SELECTEDVALUE function with
VAR SelectedDate = MAX( Dates[DateKey] )

Which seems to work, I think. So rather than just looking for the selected ‘DateKey’ value, it now takes whatever date context it is given, and looks for the MAX of the ‘DateKey’ value. Is that correct?

Hmm, I don’t think the YTD version of this works as I want it to.
I think it is calculating the YTD result for each sub measure individually, rather than considering the combined weekly results as a single table of values.
This image shows it better than a table of numbers:

image

So is it possible to work around this by putting the revised results into a virtual table and then running the YTD calculation over that?

I would presume so but hard to say exactly. Have you given this a try?

The virtual table should essentially hard code the logic built into through the via calculations. Then the YTD function would just look at the one number and not other logic sitting in behind it.

No I haven’t even thought any further than the general idea yet - any suggestions on where I should start?

I probably need a bit more info to assist here.

I see a chart of a % YTD, but don’t see any formula or context around how this is being calculated.

It isn’t too complicated. The base measure is now:

  Assignment Accuracy Revised =
VAR SelectedDate =
    MAX ( Dates[DateKey] )
RETURN
    SWITCH (
        TRUE (),
        SelectedDate <= DATE ( 2018, 03, 04 ), [Assignment Accuracy Before 04/03/18],
        SelectedDate > DATE ( 2018, 03, 04 ), [Assignment Accuracy After 04/03/18],
        BLANK ()
    )

And the YTD measure is:

Assignment Accuracy Revised YTD =
    CALCULATE (
        [Assignment Accuracy Revised],
        DATESYTD ( Dates[DateKey], "2018-07-31" )
    )

Interestingly if you add the formula without a space above it the formatting for the forum doesn’t work. I just worked that out then and is why it wasn’t formatting for you.

No matter how many times I was clicking that button it wouldn’t work :crazy_face: I even tried doing it using Edge!

Want to try something like this with CALCULATETABLE

Results YTD = 
SUMX(
    CALCULATETABLE(
        SUMMARIZE( Dates, Dates[Date],
        "Sales", [Total Sales] ),
            DATESYTD( Dates[Date], "30/6" ) ),
         [Sales] )

The technique seems to be doing the trick.

image

The concept probably works- i.e. calculate a table of every date value for the measure for the dates YTD, then do a sum of those values

However, using a SUMX gives me results of 4000% towards the end of the year, because it is doing a sum of the weekly percentage results.
Using AVERAGEX will probably give a near enough result.

Unless do you think I should go back and apply the CALCULATETABLE logic at the raw data level - before I calculate the % result? (I start out with a # of passes value and a total # value)

Maybe that’s a good idea to try. Give it a go and see if it improves at all.

Yeah that’s the one. Running a SUMX over the calculated table of passes / totals gives me a cumulative result, then doing a DATESYTD around the DIVIDE function wraps it up nicely.

It’s not that different from the AVERAGEX result, but overall a smoother curve.

Thanks again for the help Sam!

That’s great. Chrs