Pivot Tables
Pivot tables in Excel are powerful tools for data analysis that allow you to summarize and analyze large amounts of data quickly and easily. Pivot tables allow you to create summary reports from large data sets by grouping, filtering, and sorting data based on different criteria.
Goals
Please follow the directions given below, which include downloading the Excel worksheet required to perform the challenge tasks. Once you have completed the download, proceed to take the challenge and test your skills.
Task
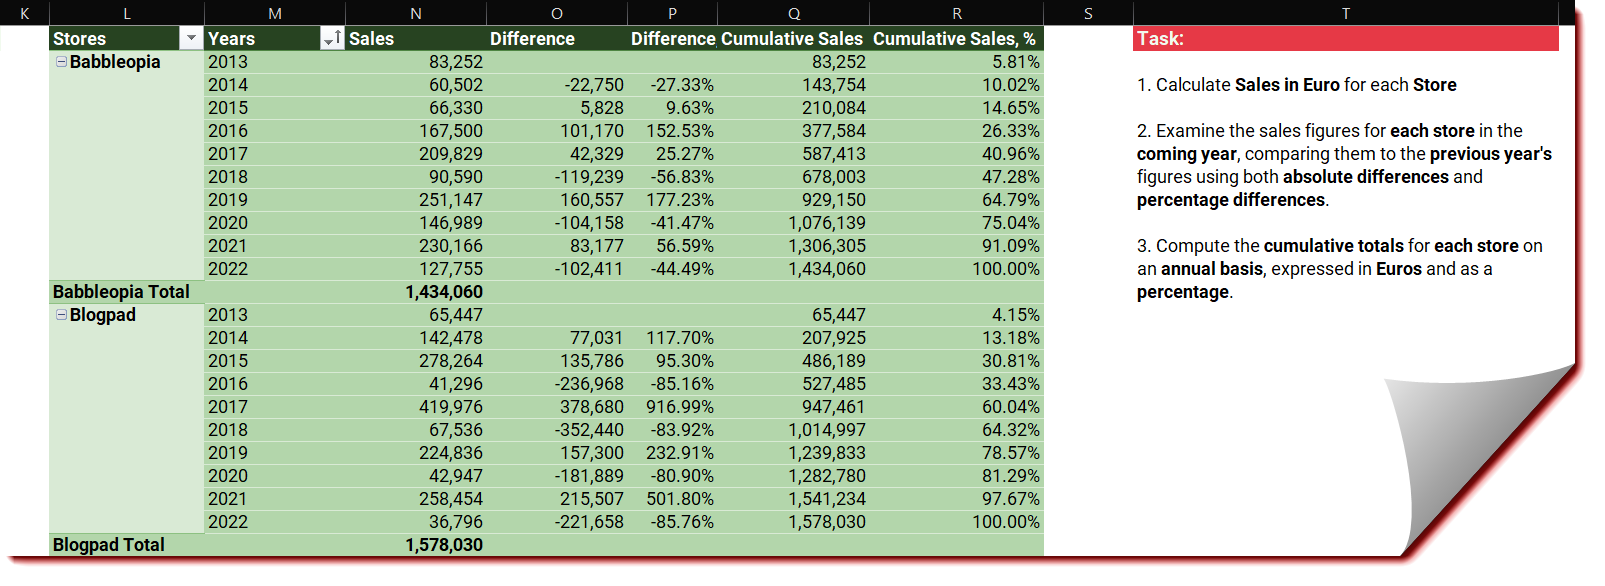
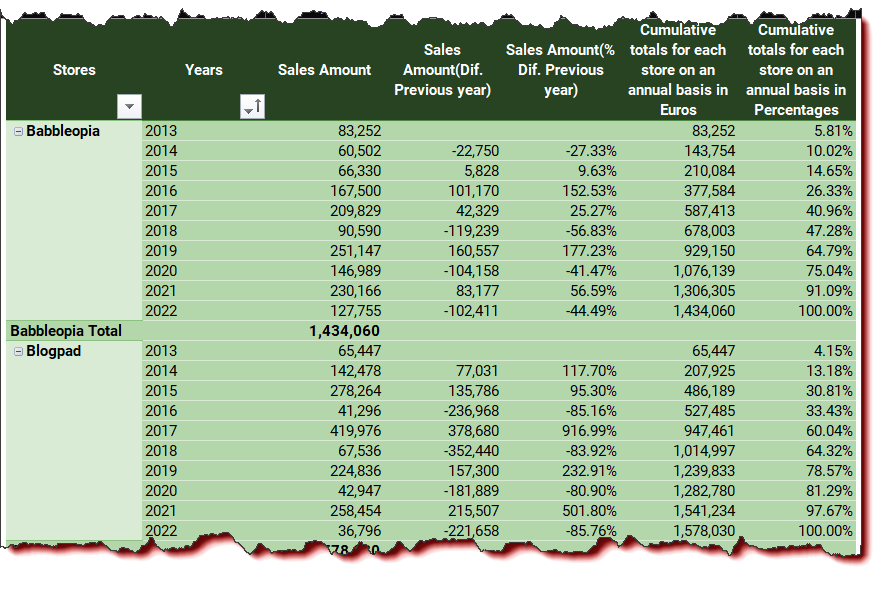
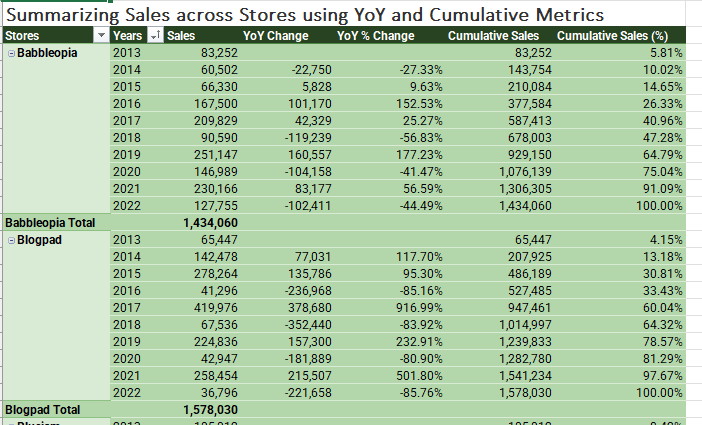
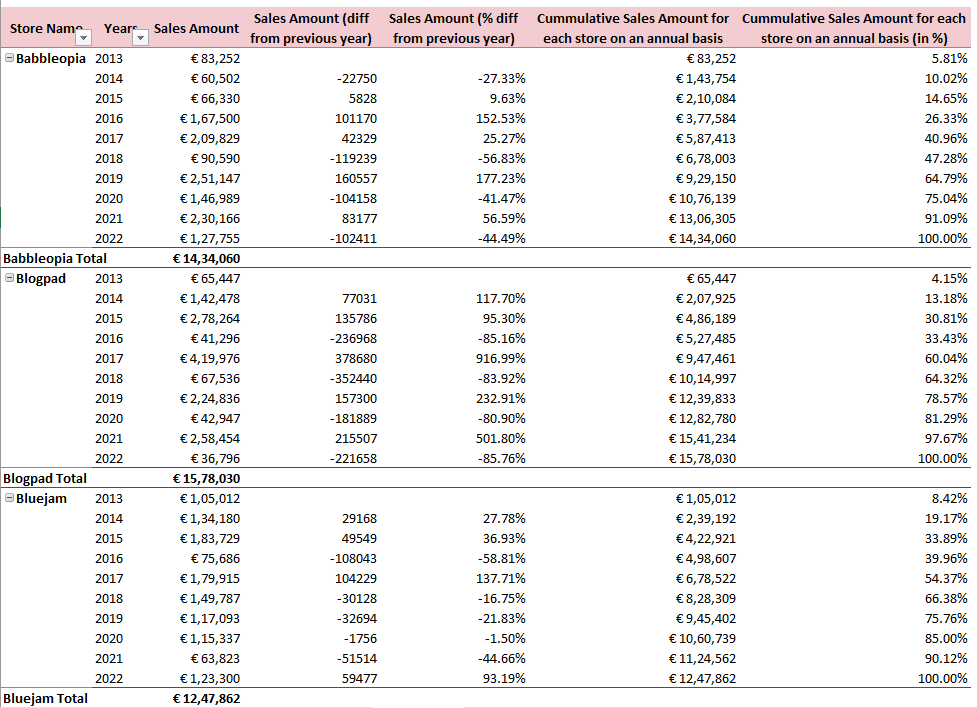
Calculate Sales in Euro for each Store
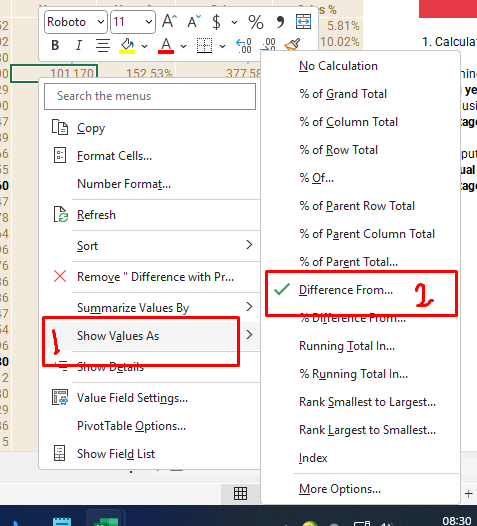
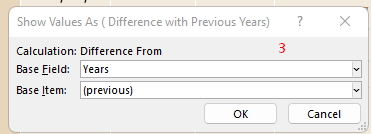
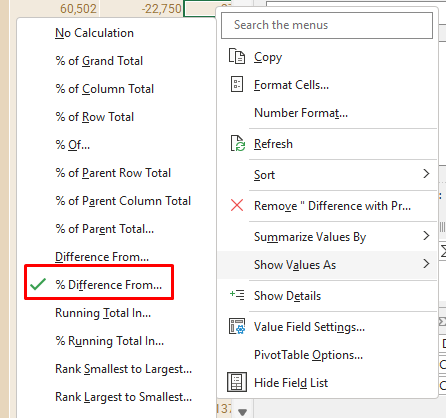
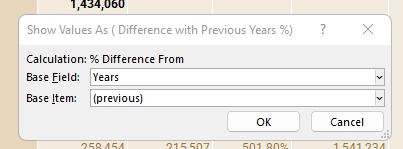
Examine the sales figures for each store in the coming year, comparing them to the previous year’s
figures using both absolute differences and percentage differences.
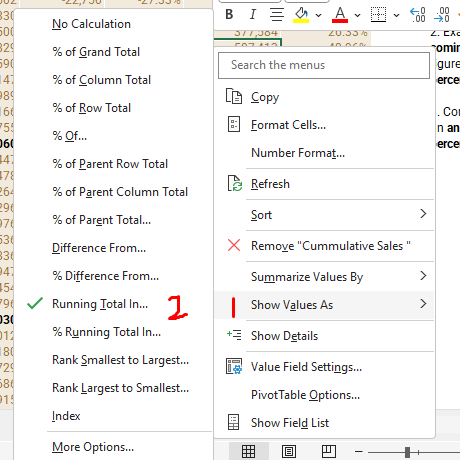
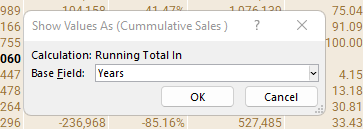
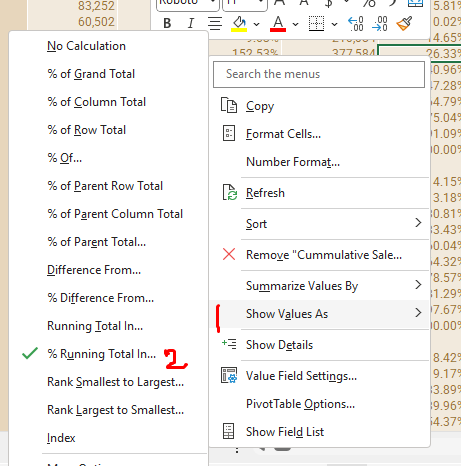
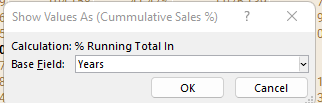
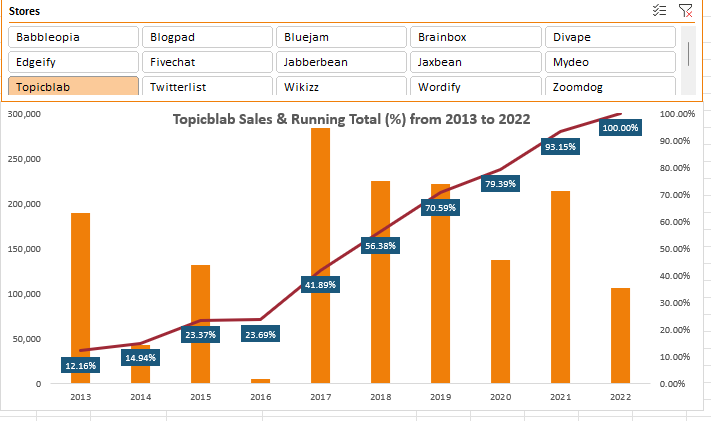
Compute the cumulative totals for each store on
an annual basis, expressed in Euros and as a percentage.
Submission
Reply to this post with your formula code and solution file. Please be sure to blur or hide your formula code.
Thank you for participating in the Excel Challenge related to Pivot Tables! I hope you found this challenge to be a fun and engaging way to improve your Excel skills and learn more about how to work with Pivot Table in Excel.