Excel Pivot Layout in Power BI

Hello EDNA Forum

I hope this email finds you all well.

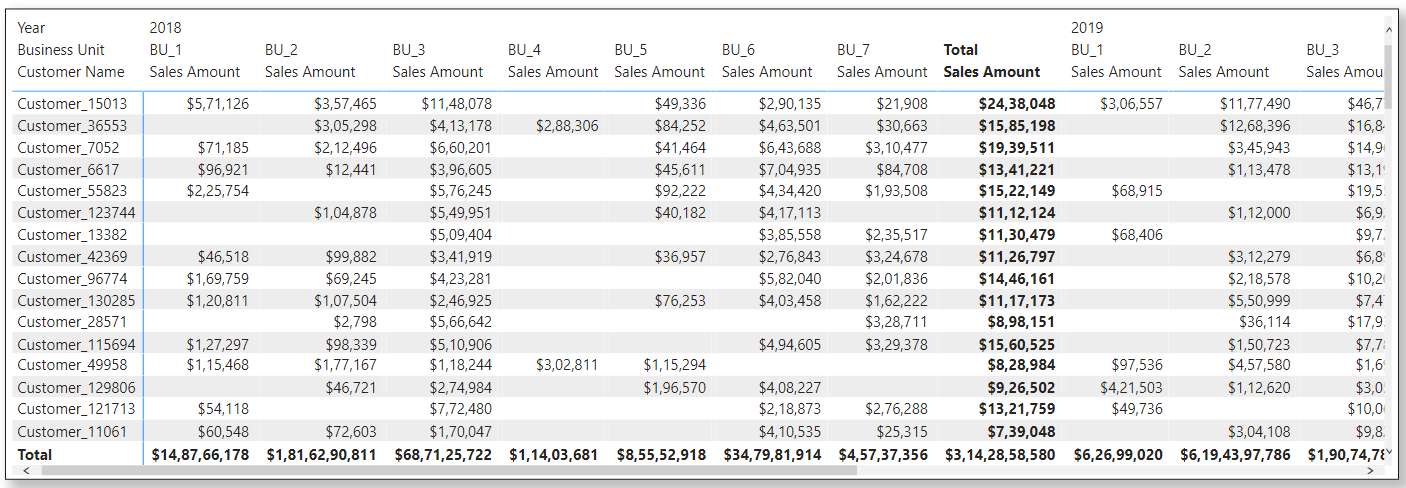
I’m trying to create an Excel pivot table layout by the following in Power BI.

Customer Name
Business Unit
Sale Amount
by year with a variance at the end between the two years 2018 and 2019

I have provided an example of the layout in Excel and a PBIX. of a sample dataset with a Dax measure for the variance This year -TY vs. Last Year - LY.

Please review the tab Variance by Business Unit

Thank you for your time in advance.

Regards,

Attachments:

Excel Layout Example.xlsx (33.9 KB) PBIXMN.pbix (15.9 MB)

Hi @ambidextrousmentally

1.- I use a Visual Table and create a measure for each BU and YEAR.

BU_1 2018 =
CALCULATE (
    [Total Sales],
    YEAR ( 'Calendar'[Date] ) = 2018,
    'Sales 2018 - 2019'[Business Unit] = "BU_1"
)

For Sales YEAR

Sales 2018 = [BU_1 2018] + [BU_2 2018] + [BU_3 2018]

and

for Variance

Variance 2018 - 2019 = [Sales 2019] - [Sales 2018]

2.- Rename each measure (for this visual)
3.- Assign a background color for each year. (optional)

Note: For this sample I work with only 3 Business Units for each year.

PBIXMN - JoseBressan.pbix (15.9 MB)

Hello @ambidextrousmentally,

Thank You for posting your query onto the Forum.

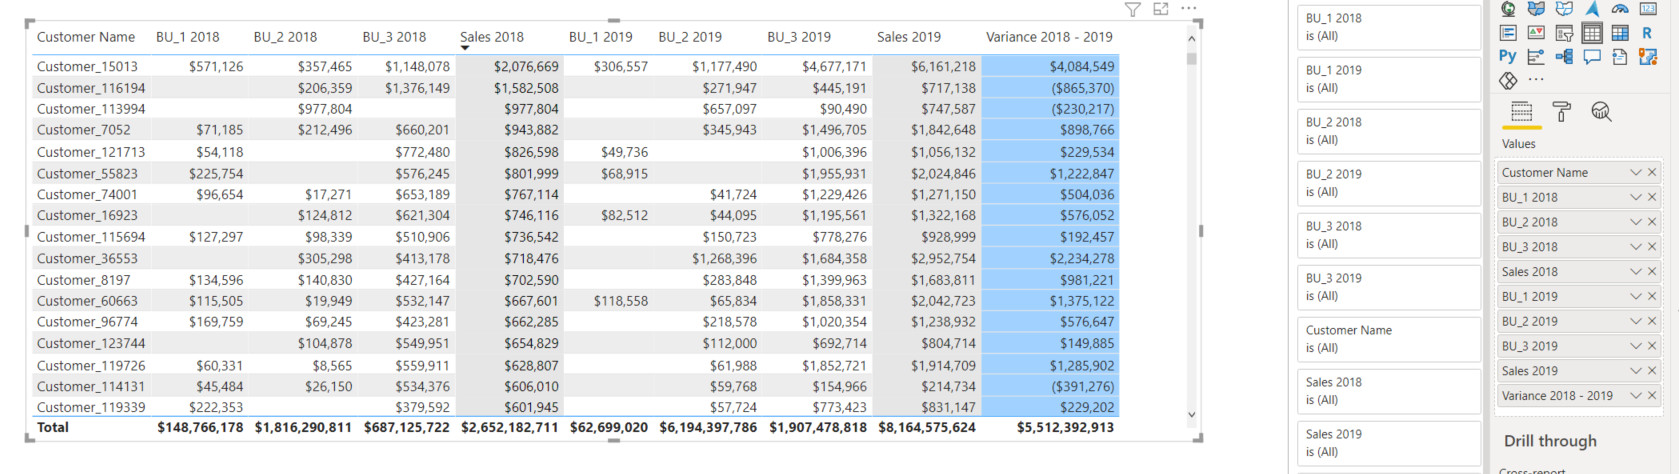
To achieve this result firstly you’ll be required to turn off the “Word Wrap” option of the following menus -

  1. Column Headers
  2. Row Headers
  3. Values

Now, once you turn off the “Word Wrap” option of the following menus. Now, just hide the columns that you don’t want to showcase in your reports, in this case, it’s the “Variance” columns. To hide the particular column just move your cursor at the headers in between the two columns and the cursor will get converted into the “Double - Sided Arrow” and than just drag it to the left-side to hide it. And by this way I’ve hidden all the “Variance” columns in the matrix visual.

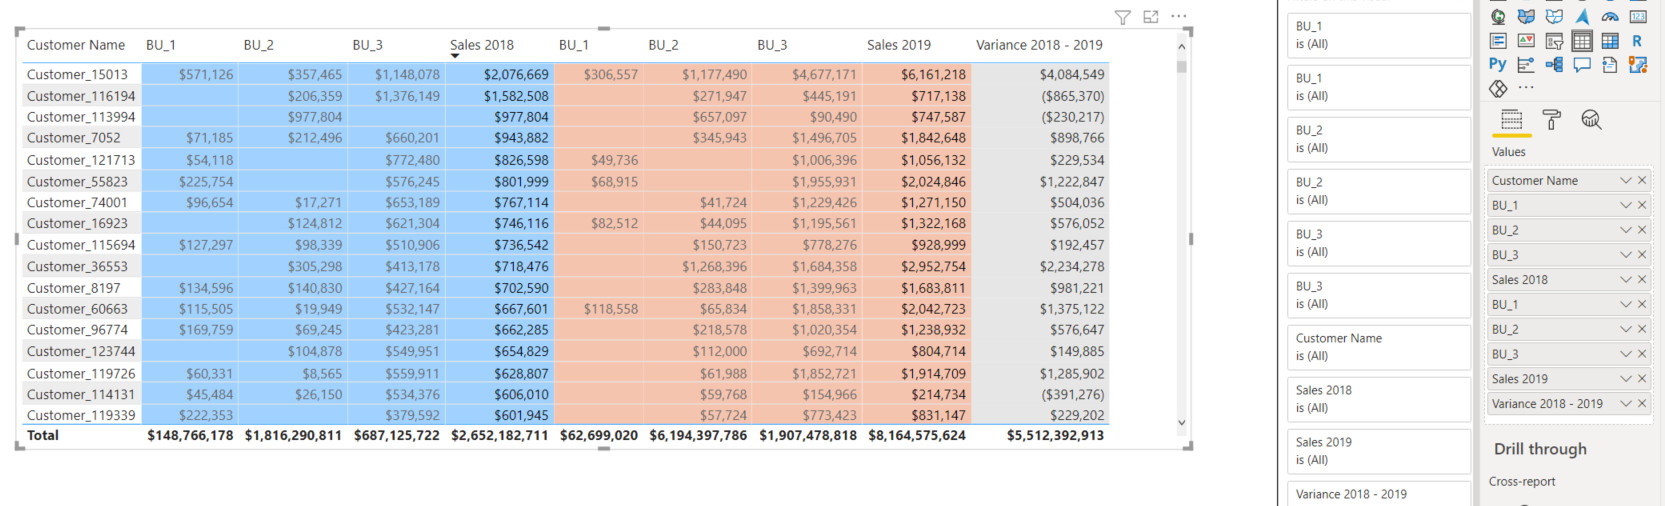
Now, to have the Sub-Totals for “Sales” and “Variance” at a columnar level like you want. Just go to the “Sub-Totals” section/menu and turn on the option of “Column Sub-Totals” and than follow the same process. That is, showcase only the columns that you want for sub-totals and hide the remaining of them.

And below is the screenshot provided of the end result -

I’m also attaching the working of the PBIX file for the reference so that you can have a close look at it.

Hoping you find this helpful and meets your requirements that you’ve been looking for. :slightly_smiling_face:

Important Note: As of now, Power BI doesn’t have the option to hide all the columns at once. So this will have to be done one-by-one.

Thanks and Warm Regards,
Harsh

PBIXMN - Harsh.pbix (15.9 MB)

1 Like

Jose/Harsh

I haven’t review the PBIX yet, but I’m certain your solutions will work. I will circle back if I have any follow up questions.

Much appreciate your help with this task and the quick turn around.

Thank you!