Error in Financial Template using the Format Function

I’ve come across an interesting problem that I’m looking for some advice on how to troubleshoot.

The report is based upon a financial template structure that is similar to that in the Financial Reporting Power BI samples that are used in the training videos.

The Financial template is creating the various rows on the report, and a single measure uses switch statement to display the correct value/measures for each report line.

The problem comes when I try to format some of the values in the switch statement. As soon as I wrap the result in a FORMAT() function, to say show the value as a percentage, it changes the number of properties I have on the report.

I’ve included a word document with that visually show how this is appearing on my report.

Does the Format function somehow change the filter context of the measure? Is there some trick that I’m missing in order to keep the properties matching what’s being filtered on the report?

Any suggestions are much appreciated.

Power BI - Switch and Format questions.docx (57.4 KB)

Hi @kevin.vertrees. Unable to get to a machine right now to look at your file, but I expect your existing measure results in numerics and the format wrapper returns text … and AFAIK you can’t mix data types within a measure. Does everything work fine with the existing numerics?
Greg

Hello @kevin.vertrees,

Thank You for posting your query onto the Forum.

Well there’s no way out with regards to the “FORMAT()” function. That is, once you use the “FORMAT()” function it converts the format into the “TEXT” based and than it also takes away the leverage of formatting the numbers using the “Formatting” menu available under the “Measure Tools” tab since it gets grayed out.

Formatting Menu

This similar type of questions have also been posted in the past as well by the forum members but to no avail. I’m providing few of the links below of the posts that were created pertaining to this very similar topic so that you can go through and check out the solutions.

I’m also attaching the working of my Income Statement file while I was practicing so that you can review it, if required.

Hoping you find this useful. :slightly_smiling_face:

Thanks and Warm Regards,
Harsh

Income Statement - Harsh.pbix (858.3 KB)

2 Likes

Hi @kevin.vertrees, did the response provided by the users and experts help you solve your query? If not, how far did you get and what kind of help you need further? If yes, kindly mark as solution the answer that solved your query. Thanks!

Thanks Harsh for this information. I have seen the greying out of the options before. The return value of the measure i’m defining is returning a text value, and I’ve been using the format function inside to format the text to that it appears correctly.

What i’m trying to understand is why that use of the format function inside this switch clause would change the overall filter context on the properties. When i don’t format the value the property values are correctly shown as the column headings. When I format the selected measure - say as a percent - a number of new properties are introduced into the final result set.

Hello @kevin.vertrees,

Firstly, as you mentioned, “use of the format function inside this switch clause would change the overall filter context on the properties.”. The “FORMAT()” function doesn’t changes the “FILTER CONTEXT” at all it just changes the formatting of the value to a text in the specified format.

After that I was not able to understand what the query actually was, that is, "When i don’t format the value the property values are correctly shown as the column headings. When I format the selected measure - say as a percent - a number of new properties are introduced into the final result set." ----- Can you please ellaborate on this about how number of “new properties” are introduced into the final results and what are these properties? And how the values are shown as “column headings”?

Thanks and Warm Regards,
Harsh

Hi - Properties are a key dimension in my model (real estate) focus, not technical properties of a power bi object. I have some screen shots in the word document i had loaded and will work on getting an example data set that shows the results I’m getting.

The visual i’m working with that the name of the real estate asset as a column on the headers of the matrix. These columns are changing depending upon whether i use a format() within the switch clause.

Hi @kevin.vertrees

I believe I understand your query. If you can share sample PBIX file as you mentioned, then I can check and provide some explanation.

Thanks
Ankit J

Hi @kevin.vertrees, we’ve noticed that no response has been received from you since the 13th of February. We are waiting for the masked demo pbix file.

In case there won’t be any activity on it in the next few days, we’ll be tagging this post as Solved. Thanks!

KV Power BI Example.pbix (32.2 MB)

I’ve attached a copy of the data that shows the problem.

Four tabs. The report is filtered for a particular fund, which contains a number of properties. These are the properties that i’ll be referring to with the other reports.

HighLevel with Format report : his displays the various metrics correctly, using the Format() function to present the underlying measures correctly.

Property with format report : This is where I’m asking for assistance. When i introduce the property as a column header, i’m seeing all of the properties in the underlying table. This is happening even thought the report is filtered for a specific fund. This is what I’ve been referring to about changing the “filter context”. The first property should be there (part of the fund), but all the other property names are showing on the column headers.

Property without format report : So, if I remove the format() function from the measure that’s displaying the results, the property names are showing correctly on the column.

Hope this explains the original post

Hello @kevin.vertrees,

The problem was within the formula which you had written. The reason why it showed blanks was because you didn’t specified the condition while using the “FORMAT()” that “what if there’s no data available for those columns” and since there was no data it started to show blanks.

The measures that were without the “FORMAT()” function those measures were able to automatically able to identify that OK since there’s no data just ignore this column. But for measures that were wrapped under the “FORMAT()” were not able to identify whether to ignore or keep the columns this happened because once you use this function blanks are also identified or traced as “TEXT” and therefore you were getting the blanks as a results for columns against which there was no data.

So how to tackle this problem -

Just use the “IF()” function logic that if a particular measure doesn’t evaulate any result for a column than keep that as a blank and therefore it’ll ignore that column. But if it evaulates to false that means if that measure derives any result than use the “FORMAT()” function and convert them into the “0.00%”. Here’s the revised formula that I’ve incorporated into your file for the reference -

Key Measure Results = VAR CurrentItem =
    SELECTEDVALUE ( 'Template - Key Measures'[Measure Normalized] )
VAR Actuals =
    SWITCH (
        TRUE (),

-- Financials
        CurrentItem = "Revenue", [Revenue],
        CurrentItem = "Utilities", [Utilities],
        CurrentItem = "Real Estate Taxes", [Real Estate Taxes],
        CurrentItem = "Operating Expenses", [Operating Expenses],
        CurrentItem = "Total Opex less RE Tax and Utilities Per Unit", [OPEx less RE Tax and Utilities Per Unit],
        CurrentItem = "Exp % w/o tax", 
        IF( [Expense % without Tax] = BLANK() , 
            BLANK() , 
            FORMAT( [Expense % without Tax], "0.00%" ) ),
--        CurrentItem = "Exp % w/o tax", FORMAT ( [Expense % without Tax], "0.0000" ),

        CurrentItem = "Exp % with tax", 
        IF( [Expense % with Tax] = BLANK() , 
            BLANK() , 
            FORMAT ( [Expense % with Tax], "0.00%" ) ),
        CurrentItem = "OPEX Variance-to-Budget", 
        IF( [Operating Expenses Variance To Budget %] = BLANK() ,
            BLANK() , 
            FORMAT ( [Operating Expenses Variance To Budget %], "Percent" ) ),
        CurrentItem = "Net Operating Income (NOI)", [NOI],
        CurrentItem = "Non-Operating Expenses", [Non-Operating Expenses],
        CurrentItem = "NOI Before Debt Service and other items", [NOI - Debt Service and Other Items],
        CurrentItem = "NOI before Debt & Other Variance to Budget", 
        IF( [NOI - Debt Service and Other Items Variance to Budget] = BLANK() , 
            BLANK() ,
            FORMAT ([NOI - Debt Service and Other Items Variance to Budget], "Percent" ) ),
        CurrentItem = "Debt Service", [Debt Service],
        CurrentItem = "DSCR", [DSCR],
        CurrentItem = "Cash Flow After Debt Service", [CFADS],
        CurrentItem = "Cash Flow After Debt Service CapEx TI & LC", [CFADS CapEx TI and LC],
        CurrentItem = "CFADS Budget Variance", 
        IF( [CFADS Variance to Budget] = BLANK() , 
            BLANK() , 
            FORMAT([CFADS Variance to Budget], "Percent") ),
        CurrentItem = "CFADS Per Unit", [CFADS per Unit],
 
-- Balance Sheet Items
        CurrentItem = "Accounts Payable - Period", [Accounts Payable],
        CurrentItem = "Accounts Payable - Balance", [Accounts Payable Balance],
        CurrentItem = "Net Accounts Receivable - Period", [Accounts Receivable],
        CurrentItem = "Net Accounts Receivable - Balance", [Accounts Receivable Balance],
        CurrentItem = "Balance Sheet Items Effecting Cash Flow", [Balance Sheet Items Effecting Cash Flow],
        CurrentItem = "Net Cash Change", [Net Cash Change],
        CurrentItem = "Operating Cash -  Period", [Operating Cash],
        CurrentItem = "Operating Cash - Balance", [Operating Cash Balance],
        CurrentItem = "Notes and Mortgage Payable", [Notes and Mortgage Payable]

        )
RETURN
    IF (
        HASONEVALUE ( 'Template - Key Measures'[Measure Normalized] ),
        Actuals,
        0
    )

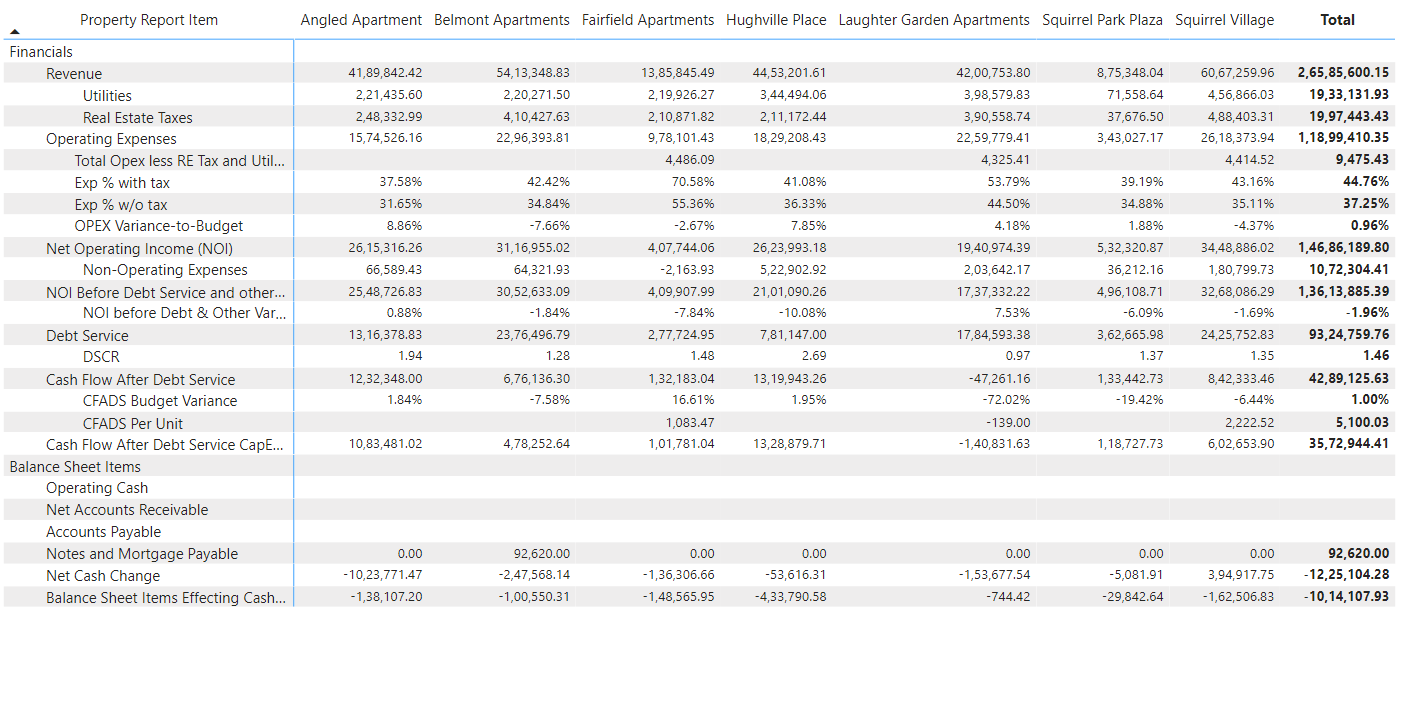
Once the formula is modified you’ll observe that all the blank columns will be ignored or eliminated. Below is the screenshot of the results provided for the reference -

I’m also attaching the working of the PBIX file for the reference so that you can review it.

Hoping you find this useful and meest your requirements that you’ve been looking for. :slightly_smiling_face:

Note:

1. As stated earlier, this was not a context issue at all. Because “FORMAT()” function just converts the value into the specified format only and doesn’t change the context of the analysis.

2. Also I observed that your file is absolutely quite large and the visuals are taking ages to load. If you don’t require any tables or columns than either disable those tables or delete those columns and trim the size of the data model.

Thanks and Warm Regards,
Harsh

KV Power BI Example.pbix (32.2 MB)

4 Likes

Hi @kevin.vertrees, did the response provided by @Harsh and @ankit help you solve your query? If not, how far did you get and what kind of help you need further? If yes, kindly mark as solution the answer that solved your query. Thanks!

Hi @kevin.vertrees, we’ve noticed that no response has been received from you since the 19th of February. We just want to check if you still need further help with this post? In case there won’t be any activity on it in the next few days, we’ll be tagging this post as Solved.

Hi @kevin.vertrees, a response on this post has been tagged as “Solution”. If you have a follow question or concern related to this topic, please remove the Solution tag first by clicking the three dots beside Reply and then untick the check box.

We’ve recently launched the Enterprise DNA Forum User Experience Survey, please feel free to answer it and give your insights on how we can further improve the Support forum. Thanks!