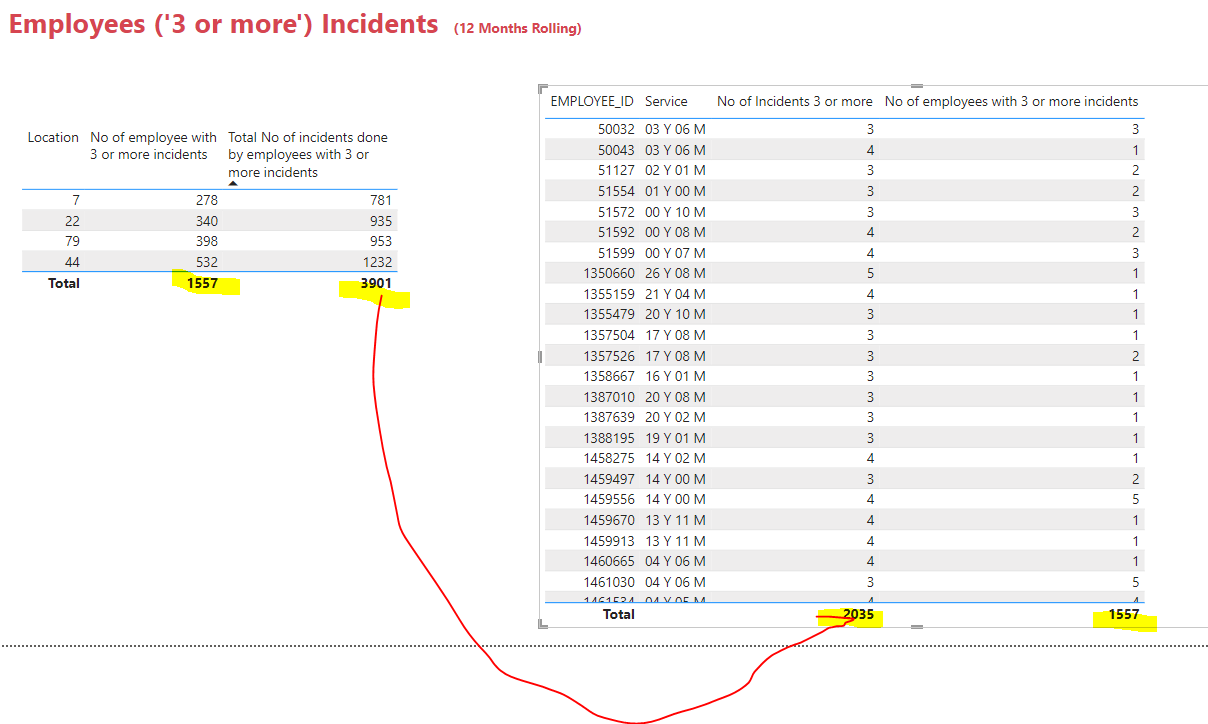
First tables should display columns with the locations and number of people who did 3 or more incidents and the count of incidents for those people only.
The second table is a breakdown of locations, Employee ID and should show only those employees with 3 or more incidents in 12 last months
My figures in both tables don’t match even though I believe my measures give me the correct values.
Hi @PankajNamekar - I assume you are aware of why difference is coming in first and second table. Just to rephrase, in First table “Total No of incidents done by employees with 3 or more incidents” there is no filter applicable for count of incidents, so it is returning even those employees having 1 incident.
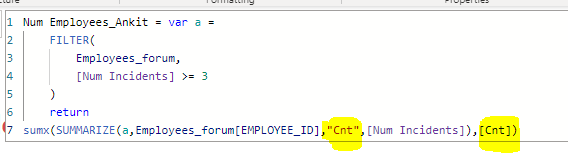
For second table, there is external visual filter applied for No of incidents, so it isconsidering only those employees having Incident count >= 3. To apply this filter in the visual itself. You can try below.
Num Employees_Ankit = var a =
    FILTER(
        Employees_forum,
        [Num Incidents] >= 3
    )
    return
sumx(SUMMARIZE(a,Employees_forum[EMPLOYEE_ID],"Cnt",[Num Incidents]),[Cnt])
Attached the PBIX file with new measure INC_forum.pbix (469.5 KB)