Hi, I need to dynamically calculating “7 days bucket” based on a date range (date filter)
See below:
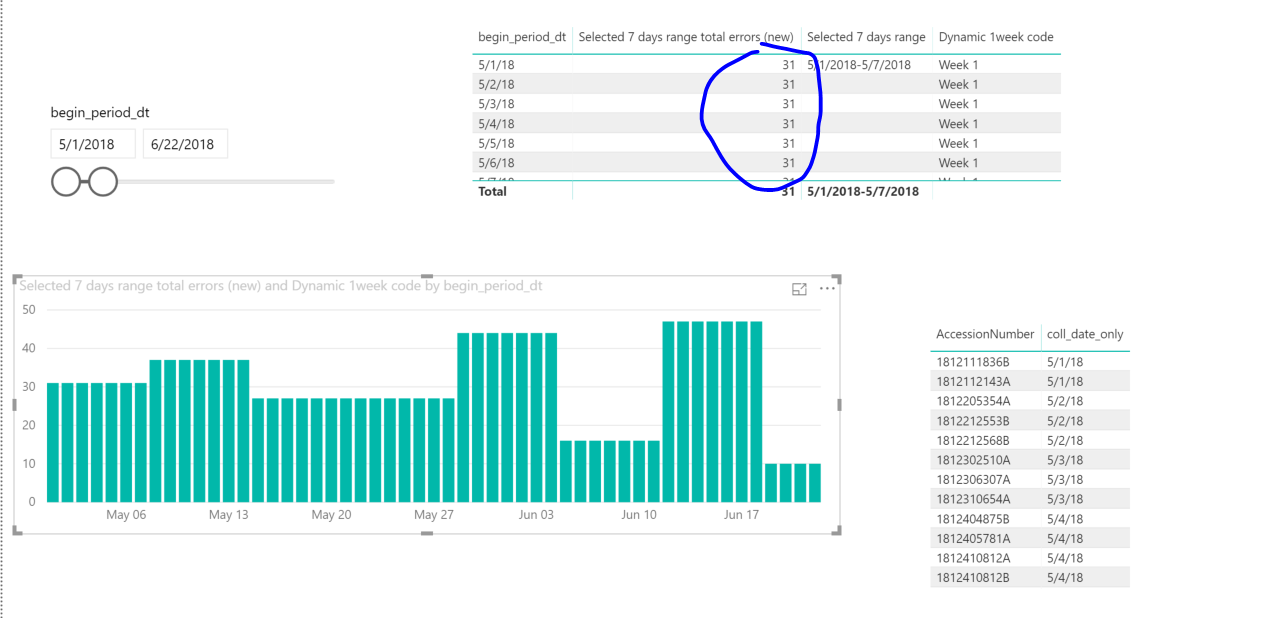
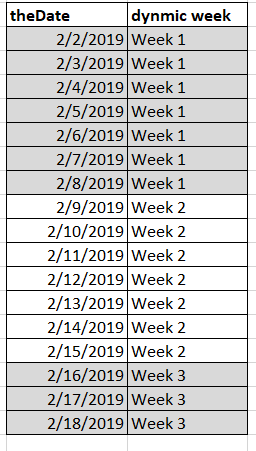
TheDate column contains AllSelected() dates from my date filter.
And I need to write a dax query to produce “dynamic Week” column value. Where I always start counting the 1st day selected as my 1 day of the week… and counting 7 days for a week… and assign “week #” bucket accordingly.
I am stuck. Not sure where and how to start. Could someone guide me ?
Also, have you gone through the weekly time intelligence videos that are made available. They show the many ways you can run time comparison logic with weeks.
Good Morning Sam.
Yes, watched those training videos before, but not helping.
Just as my example shown above, I need to dynamically calculate the week not based on the time intelligent function, or week number, but always start counting the 1st day selected as day 1, 2nd day selected = day 2 ,… so forth till day 7, this bucket = Week 1 bucket.
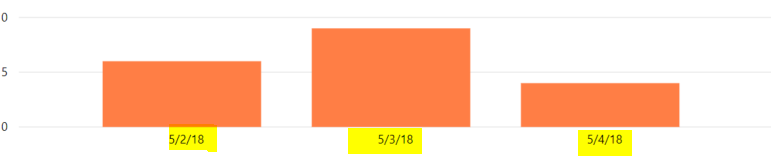
The end visual is a simple bar graph where X-axis is “Week 1”, “week 2” … Y -axis = # orders.
Sample chart: imagine the X-Axis is being replaced with Week 1, Week 2, Week 3… etc
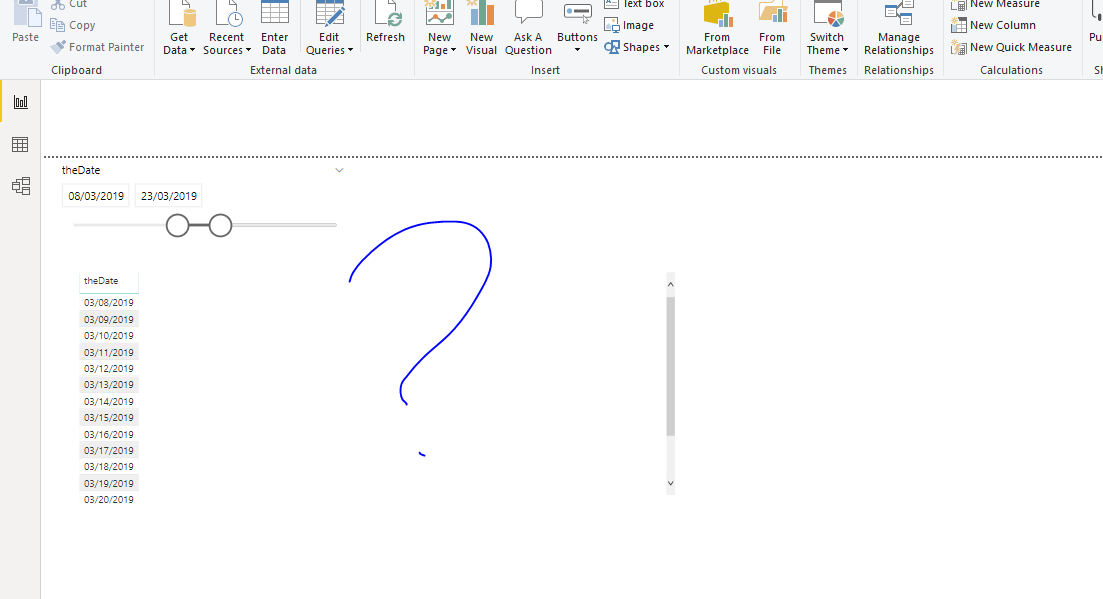
As you can see in this measure you need the Calendar’[theDate] value to calculate the [Dynamic week] measure for each row, so in your first scenario this would work fine.
But in your second scenario this won’t do for two reasons first you’re missing the Calendar’[theDate] but more important you cannot place a measure on the Axis of the bar chart…
Also you can’t solve this by adding a calculated column to your Calandar table if your date selection is truly dynamic because that will only get evaluated once at refresh time.
So I think you might need to explore alternatives or consider standard weeknumbers.
Hi Melissa, thanks for your sharing. This is awesome !!
Yes, you are right, I am not able to ‘anchor’ the Dynamic Week to my bar chart. But it allows me to move to next step. Let me play with a summary table by ‘anchoring’ the data to chart with MIN(‘Calendar’[theDate] ) instead of text = Week 1, Week 2.
 Let me play with a summary table by ‘anchoring’ the data to chart with MIN(‘Calendar’[theDate] ) instead of text = Week 1, Week 2.