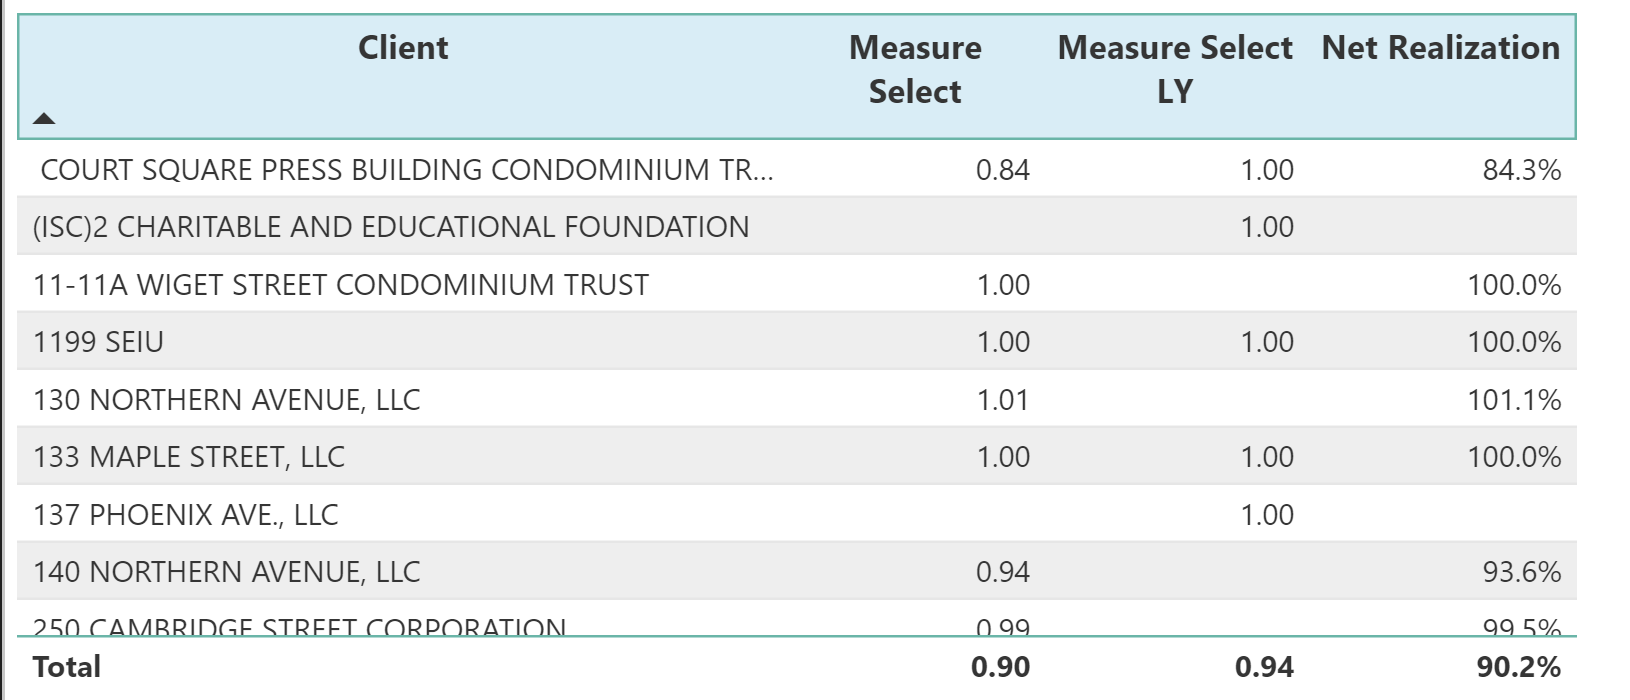
The dynamic measure tutorial was great. I noticed, however, that when using dynamic measures the number formatting set for the selected measure does not work as it does when displaying the measure value by dragging and dropping the measure itself. For example, a measure that calculates a percentage displays in the correct percent format in a chart (e.g., 88.2%) when dragging the standalone measure into the chart. But that same measure when selected using the dynamic measure selector displays differently (e.g., .88). Any way to resolve this?
Yes unfortunately there is no way around this at the moment. When using this technique you can only really use measure of the same format, as you can’t change the format based on what measure is showing.
It’s one of the restrictions of this technique, even though it is a really good one.