Brian, I have been looking at this a bit more and found a workaround for Issue 2 that you pointed out above. If you use an IF to format only for non-blank values, the dynamic column functionality still works. Here is an example which formats Total Line Sales as %.
  Matrix Switch =
    SWITCH (
        SELECTEDVALUE ( 'Matrix Column Headers'[Headers] ),
        "Total Line Sales", IF( [Total Sales Dynamic] = BLANK(), BLANK(), FORMAT( [Total Sales Dynamic]/100, "0.0%" ) ),
        "Total Sales LY", [Total Sales LY Dynamic],
        "Sales Rank", [Sales Rank Dynamic]
A couple of other issues have come up for me. First, the column subtotals don’t work which I haven’t been able to figure out. I have a feeling that this may be difficult to solve, but maybe I am missing something. Second, I have been trying to add another hierarchy level on the columns which works fine if I add it manually to the Columns Values in the Visual, but I would like to be able to add and remove that level dynamically as well. Here is a screenshot of what I have:
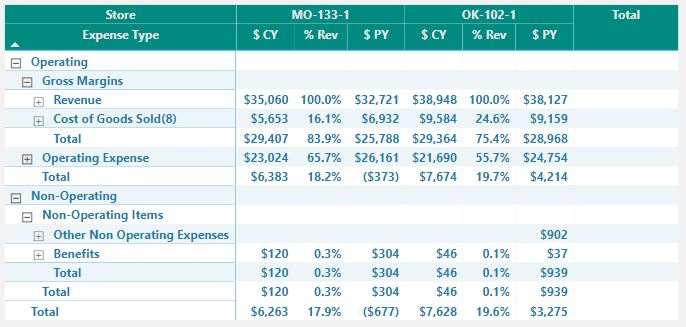
Is there an easy way to add this extra layer? The calcs should be the same, it should just be adding the location field to the column hierarchy dynamically.
Thanks!