Hi everyone,
Thank you for all the support provided in this forum.
I followed this article
Here is my measure:
Count of Users with Disorders =

    VAR Userdisorders =

SUMMARIZE(

Assessment,

Assessment[User ID],

"Count of Conditions",

[Disorders Ct]

)

Return

CALCULATE(

COUNTROWS(

FILTER(

Userdisorders,

[Count of Conditions] = [Segment Value] ) ))
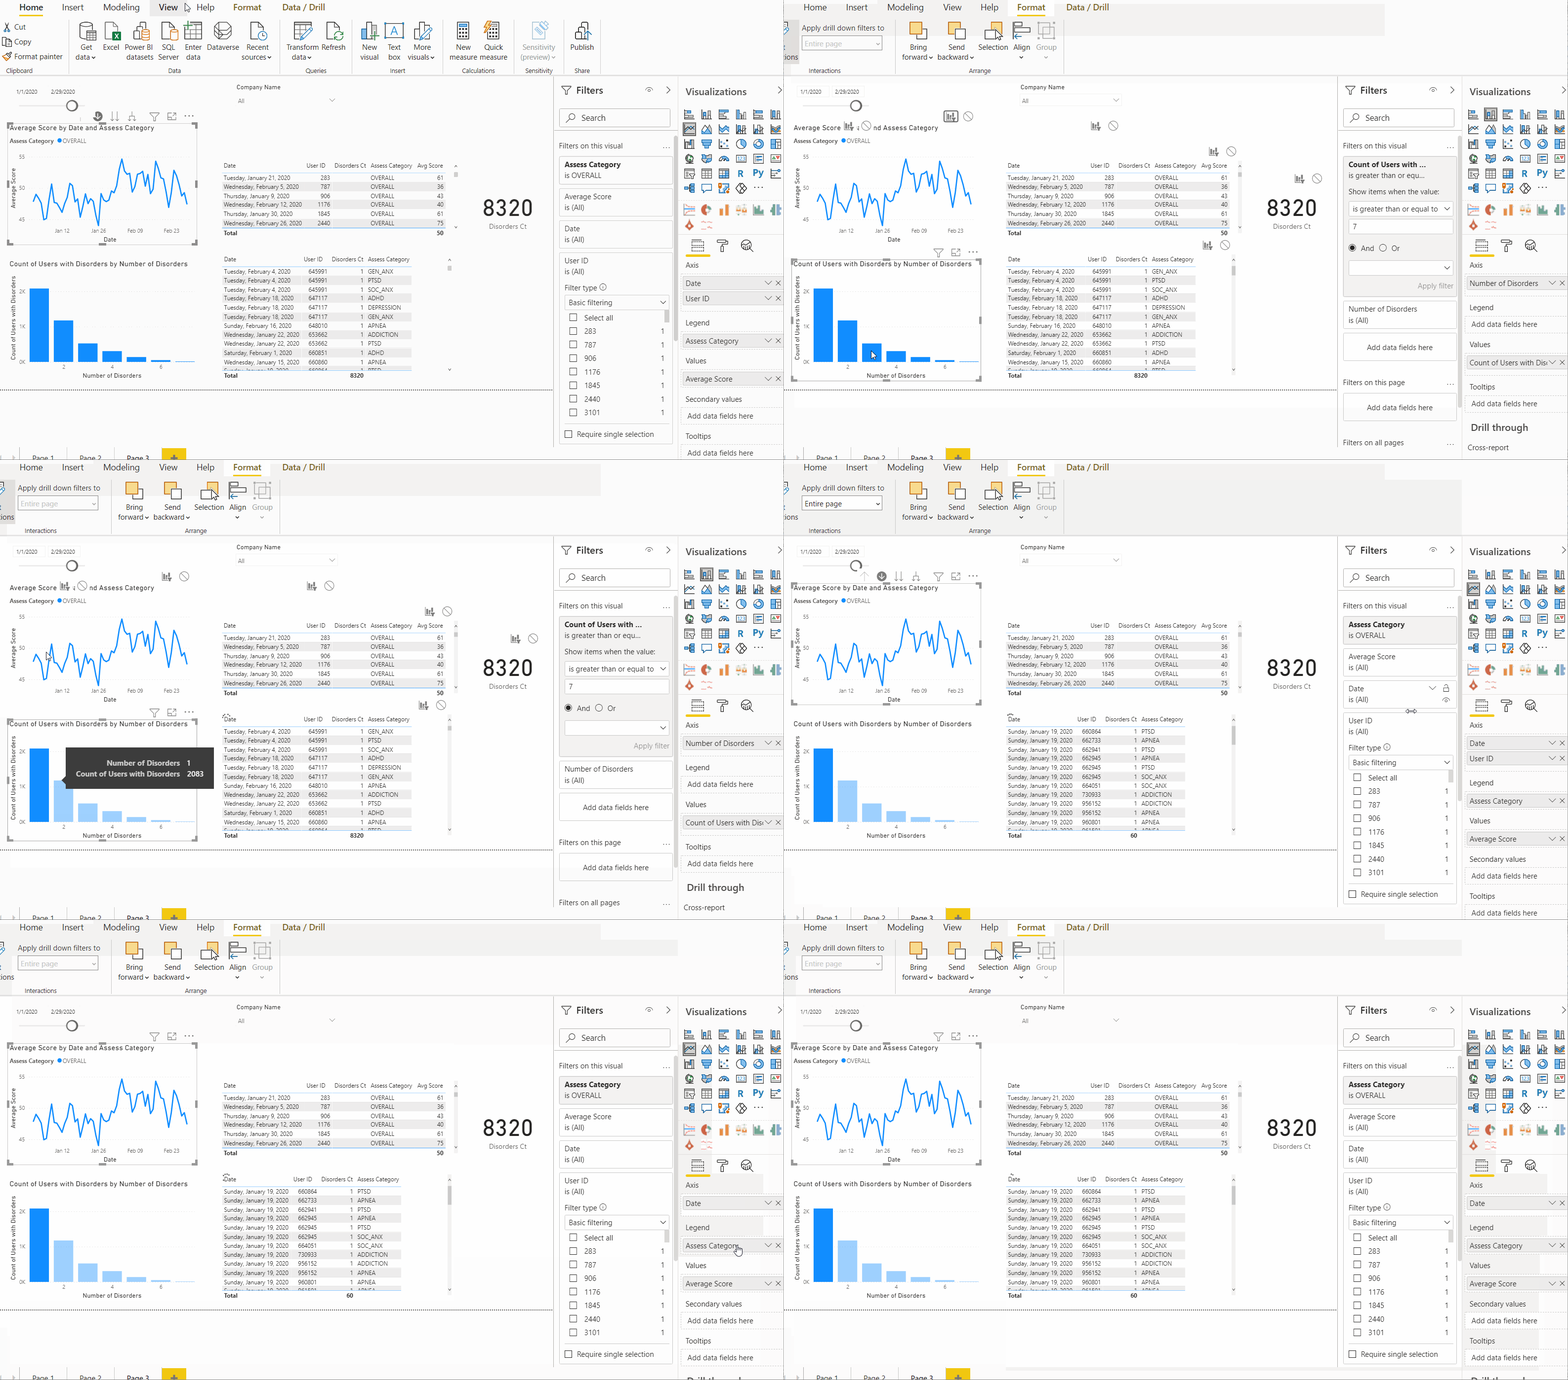
Here is what I got.

the segmentation is working fine, but it’s not dynamic. When I click on a group it doesn’t filter the data in the table or any other virtual.
I am trying to analyze the behavior of the segmented users in another visual.
In other words, I want to be able to click on one group or one segment and show their scores “another measure” on another line graph.
For instance, I only want to show the avg scores “another measure” for the 306 users on segmentation 4 on a line graph.
This is the measure:
Average Score =

CALCULATE(

DIVIDE(SUM(Assessment[Assess Score]), COUNT(Assessment[User ID] ) )

) *100
I also tried to edit the interactions, but I don’t think it’s the answer here. Even when I click on the segments the data doesn’t filter in the table for that specific segment.

Maybe what I am trying to do is to create a relationship between the two graphs in a measure or something so when I click on one group, only show their data on the graph. I am not sure what I need here.
Any recommendations?segmentation sample.pbix (9.4 MB)
Thank you all for the help!