How can I calculate the correct total having created the dynamic top 20% of customers.
One video shows using the TOPN but this has a hard code eg 10 whereas the top 20% pattern has a dynamic ranking number for the TOPN
Adding the formula you are using would be helpful here and also an image of the results you are receiving.
As much information as possible will assist in getting the correct answer as quickly as possible.
If will most likely be a small adjustment around the formula. Something like IF( HASONEVALUE( etc… or IF( ISFILTERED( …
Top 20% Trans = IF([Customer Rank]<(IF(RANKX(ALL(Customer),[# Trans],DESC) < (CALCULATE([# Customers],ALL(Customer)) * 0.2), [# Trans],BLANK())),[# Trans],BLANK())
The total is for all not just the top 20%
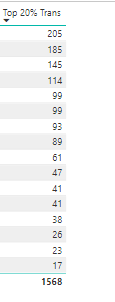
This is what the video has using the TOPN but I can’t use this because the number of customers that make up the Top 20% varies
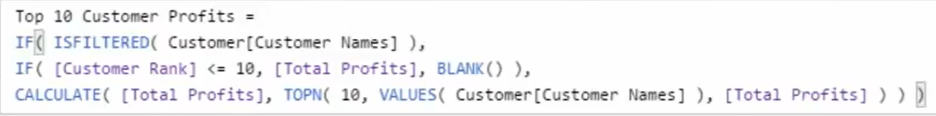
You want to be using something like the below example.
With some additions to get the right total.
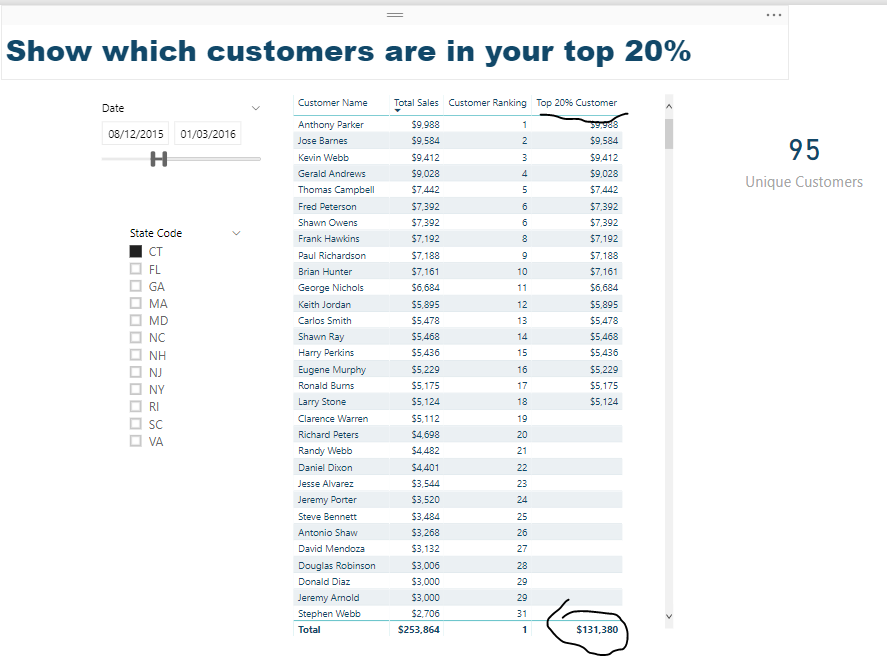
Here’s a full formula that’s gets the correct result
Top 20% Customer =
VAR CustomerRank = RANKX( ALL( Customers ), [Total Sales], , DESC )
VAR UniqueCustomers =  CALCULATE( [Unique Customers], ALL( Customers ) )
VAR Top20 = UniqueCustomers * 0.2

RETURN
IF( ISFILTERED( Customers[Customer Name] ),
    IF( CustomerRank < Top20, [Total Sales], BLANK() ),
        CALCULATE( [Total Sales], TOPN( Top20, ALL( Customers ), [Total Sales], DESC ) ) )
See below
Check out the model which is available here…it’s actually even more updated than the video shows but uses similar techniques.
Thank you Sam. All working now.
How can I adapt it to show the bottom 80% of customers with values? Is there an opposite to TOPN?
Just change the DESC to ASC and adjust the formula to 80%
Should be easy
@sam.mckay what if we want to represent the 20 % TOP and the 20 % Bottom in the same column for those Customers in evry city for example