Hello EDNA Community!
I am looking to enhance metric result reporting by making the visuals dynamically react to selected time period groups & specific slicer selections. I have made headway on my objectives, but am currently stuck on getting to 100%.
Attached is a file that illistrates my objectives & progress. Also adding details below. Appreciate an suggestions!
–
Data Model:
dim_DateFWeek - Date table that allows me to show my 4 Fiscal period groupings. There are two columns I use for visuals, one shows the “standard” value (FW01 2024) and another shows “Filter” value that shows the standard value or the text “Current” / “Prior” when it is applicable.
fact_AdjustmentRate - Fact table showing my results over time
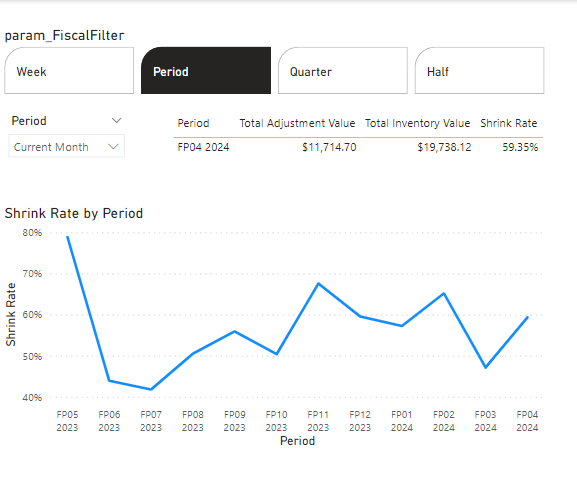
param_FiscalFilter - Parameter to switch between Fiscal Periods for Filters use
param_FiscalStandard - Parameter to switch between Fiscal Periods for Standard use
Objective:
- Dynamically switch time periods being shown in visuals using the “Standard” values.
- Dynamically switch slicers using the “Filter” values.
- Slicer value defaults to the 1st value in DESCENDING order
- Line graph always shows a maximum of 6 periods in the X-Axis
- The periods shows are the slicer value & the next 5 periods in descending order (i.e Slicer = W06, visual will show W06, W05, W04, W03, W02, W01)
Status:
I am currently achieving objectives 1 & 2 through the parameter & visual set up.
Objective 3 is done through a calculated column creating a reverse offset - I am open to improvements on this method.
I am stumped on Objectives 4 & 5