Hello,
I am working on a billability project where I have a list of employees who are part time or full time, and this impacts how many hours they are available each month.
The attached pbix file includes a date table which has a field indicating which days are work days (excluding holidays and weekends).
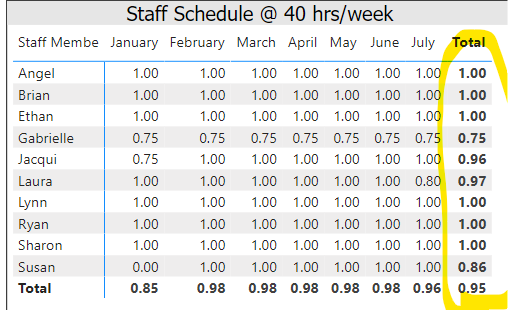
I also have a “work schedule” table that lists all the employees, and their part time vs full time status.
1 = 8hrs/work day. .75 = 6hrs/work day. And so on. their work schedule can change on a monthly basis.
I’ve created measures to count up the total work days in each month, as well as the total possible working hours in a month based on a 40hr/week work schedule.
I’ve also created measures to multiply the value of an individual employee’s schedule (which can change from month to month as outlined in the work schedule table) by the total available hours in a selected month.
I want to be able to track how many hours each employee is available each month based on their changing work schedule. Some employees start part time, then go full time, and vice versa. And I need this to be dynamic.
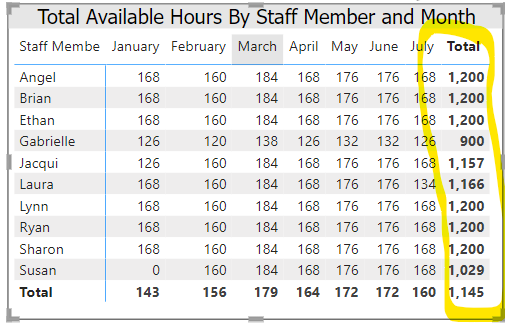
The issue is occurring when the values roll up. For example, my calculations will show the correct value each month, but will display a YTD total which is off.
I attached a pbix file as well as the associated staff schedule excel file. The attached screen shot shows where the error is occurring (circled in yellow). The values are correct for each individual month, but the totals and grand totals don’t add up.
I think it’s because I’m using an AVERAGEX as part of my logic (which I pulled from an enterpriseDNA instructional video): https://www.youtube.com/watch?v=XHHkKamqeCU&feature=emb_logo
Thank you in advance for any ideas you have!
Best,
Pete
Enterprise DNA Forum.pbix (398.1 KB)
Staff Schedule.xlsx (11.0 KB)