Dynamic reporting of accounts receivables ageing

Hi
I’ve been listening to one of the Webinar Series Resources on ageing of accounts receivable - here is the link,

As the date slicer is moved around, the total value does not change dynamically for the reports on the page - (just after about 55 mins on the recording).
I’ve tried to do a fix but unable to.
Would appreciate if I could please get some help understanding what needs to be fixed to report the correct results as the date slicer is changed.
Thanks
Manoj

Hello @M_K,

Thank You for posting your query onto the Forum.

The Total Invoices amount didn’t changed because there’s no active relationship between Dates table and the Accounts Receivable table due to multiple dates involved. Below is the screenshot provided for the reference.

In order to activate the relationship and find out the total invoices value by each of the respective dates you can try out the below formulas to activate the relationships by using the USERELATIONSHIP() function. Below are the formulas provided for the reference -

Total Invoices by Due Date = 
CALCULATE( [Total Invoices] , 
    USERELATIONSHIP( Dates[Date] , 'Accounts Receivable'[Due Date] ) ) 

Total Invoices by Invoice Date = 
CALCULATE( [Total Invoices],
    USERELATIONSHIP( Dates[Date], 'Accounts Receivable'[Invoice Date] ) )

Total Invoices by Settlement Date = 
CALCULATE( [Total Invoices],
    USERELATIONSHIP( Dates[Date], 'Accounts Receivable'[Settled Date] ) )

Now, you can see that that total invoices values changes dynamically as per the selection in the slicer. Below is the screenshot provided for the reference -

Also attaching the working of the PBIX file for the reference.

Lastly, I’m also providing few of the links of the videos created by @sam.mckay about how to handle multiple dates in Power BI.

Hoping you find this useful and meets your requirements. :slightly_smiling_face:

Thanks and Warm Regards,
Harsh

Dynamic Accounts Receivable - 1.pbix (268.8 KB)

2 Likes

Thanks Harsh for highlighting the need to use USEREALATIONSHIP :slight_smile:
That certainly helps.

My original query is in relation to the reports on Page 2.

Note, the total value is $16.67m when the date selected is 01/05/2012

If I were to change the date to 16/02/2013, the total remains at $16.67m - although the ageing has changed

It seems the current set up it reporting total value of invoices irrespective of the timeframe?

I would have expected the total and the ageing to change. For example, if I had selected 01/05/2012, the report should show invoices raised before 01/05/2012 and not paid, and age them accordingly.

Thanks and regards
Manoj

Hello @M_K,

Is this the result that you’re looking for? Below is the screenshot provided for the reference.

In the above screenshot, it shows the value where invoices were raised on or before the selected date and has aged then accordingly as per the due date.

Below is the formula provided that I’ve used to arrive at this figure -

Invoices raised before selected date = 
CALCULATE( [Total Invoices] , 
    FILTER( ALLSELECTED( Dates ) , 
        Dates[Date] <= [Date Selected] ) , 
        USERELATIONSHIP( Dates[Date] , 'Accounts Receivable'[Invoice Date] ) )

Receivables Groupings by Due Date 2 = 
CALCULATE( [Invoices raised before selected date] ,
    FILTER(
        VALUES
           ('Accounts Receivable'[Invoice Number] ),
            COUNTROWS(
                FILTER(
                  'Receivables Groups',
                   [Days To Due Date] >='Receivables Groups'[Min] 
                  &&[Days To Due Date] <='Receivables Groups'[Max]
                )
            ) > 0
    )
)

I’m also attaching the PBIX file of the working for the reference.

Hoping you find this useful and meets your requirements. :slightly_smiling_face:

Thanks and Warm Regards,
Harsh

Dynamic Accounts Receivable - 2.pbix (270.2 KB)

1 Like

Thanks Harsh for the quick response.

I’ve attached a copy of the Excel file to help explain what I’m trying to achieve.
The selected date is in cell N1. If I input 01/05/12 the value is $732k, all of which is under 0-60 days.

AR Table.xlsx (367.9 KB)

I’ve just realised that the due date is 30 days after the invoice date (in the Accounts Receivable table) - in which case the ageing will always sit under 0-60 days. If that’s the case, I’m not sure why the ageing was done in the first place. May be I’m unclear on the original intent of resource?

Regards
Manoj

Hello @M_K,

Well the course was just created from the educational point of view. And the original intent was to showcase how Ageing analysis can be done in Power BI. And once we understand the concept we can simply diversify our analysis as per the desired requirements.

Well yes, agreed that Due Date is within one month of the Invoice Date and that is the general scenario where businesses provide a certain credit period to their regular customers. So Due Date for the most of the businesses remain constant more often than not unless business organization follows the practice of providing different credit periods depending upon their relations and transactions with the respective customers.

In the given video, Sam had created the Table using the “Enter Data” option so once that table got created it cannot be modified. But you can also create the table using “New Table” option. As you mentioned above that -

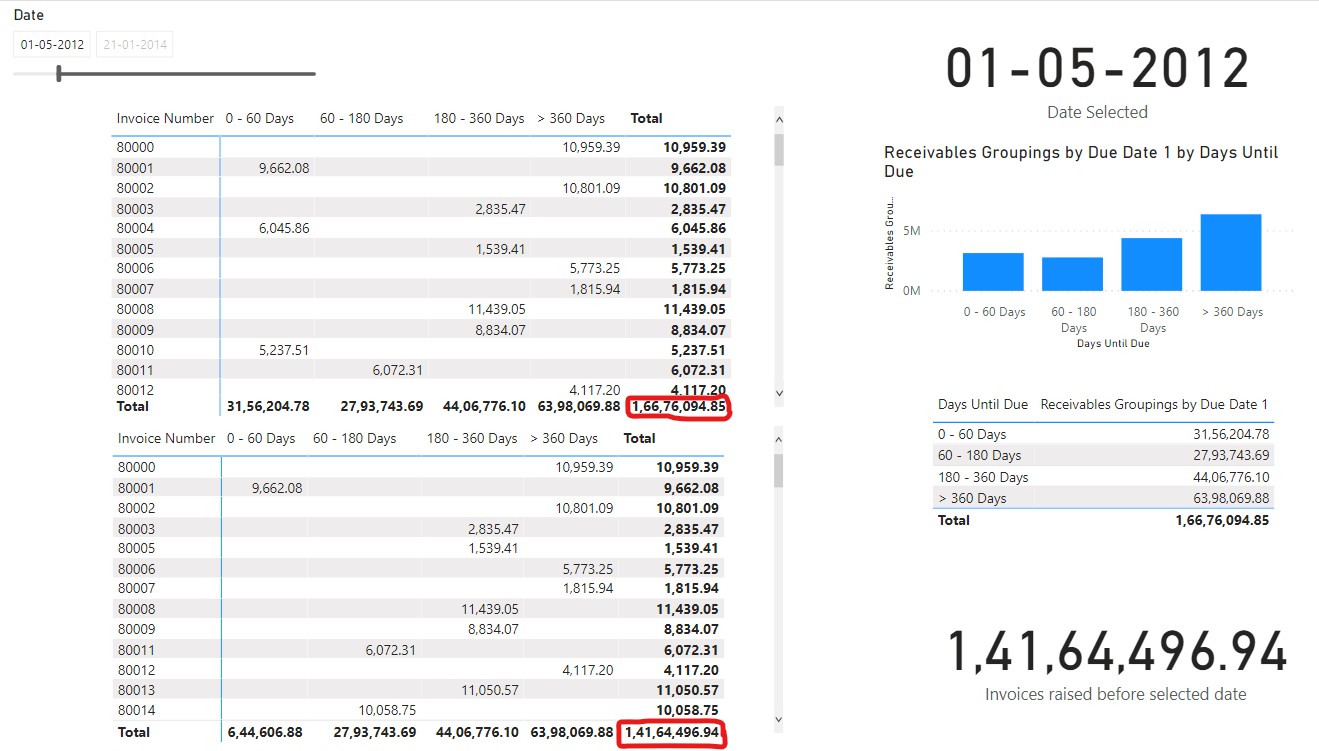
“I’ve just realised that the due date is 30 days after the invoice date (in the Accounts Receivable table) - in which case the ageing will always sit under 0-60 days.”

You can create a dynamic table by writing the DAX using UNION( ROW() ) function where you can change the minimum and maximum period as per your requirements which is not possible if you just create a table using “Enter Data” option as mentioned above.

So below is the DAX code mentioned to create - “Dynamic Receivables Group

Dynamic Receivables Group = 
UNION(
    ROW( "Days Until Due" , "0 - 30 Days", "MIN" , 0 , "MAX" , 30 ) ,
    ROW( "Days Until Due" , "31 - 60 Days" , "MIN" , 30 , "MAX" , 60 ) ,
    ROW( "Days Until Due" , "61 - 120 Days" , "MIN" , 60 , "MAX" , 120  ) , 
    ROW( "Days Until Due" , "121 - 240 Days" , "MIN" , 120 , "MAX" , 240 ) , 
    ROW( "Days Until Due" , "241 - 360 Days" , "MIN" , 240 , "MAX" , 360 ) , 
    ROW( "Days Until Due" , "360+ Days" , "MIN" , 360 , "MAX" , 100000 ) )

Once you’ve created this dynamic table, just replace the “Receivables Group Table” with the “Dynamic Receivables Group Table”. Below is the formula provided for the reference -

Receivables Groupings by Due Date 3 = 
CALCULATE( [Invoices raised before selected date] ,
    FILTER(
        VALUES
           ('Accounts Receivable'[Invoice Number] ) ,
            COUNTROWS(
                FILTER(
                  'Dynamic Receivables Group' ,
                   [Days To Due Date] >='Dynamic Receivables Group'[MIN] 
                  &&[Days To Due Date] <='Dynamic Receivables Group'[MAX]
                )
            ) > 0
    )
)

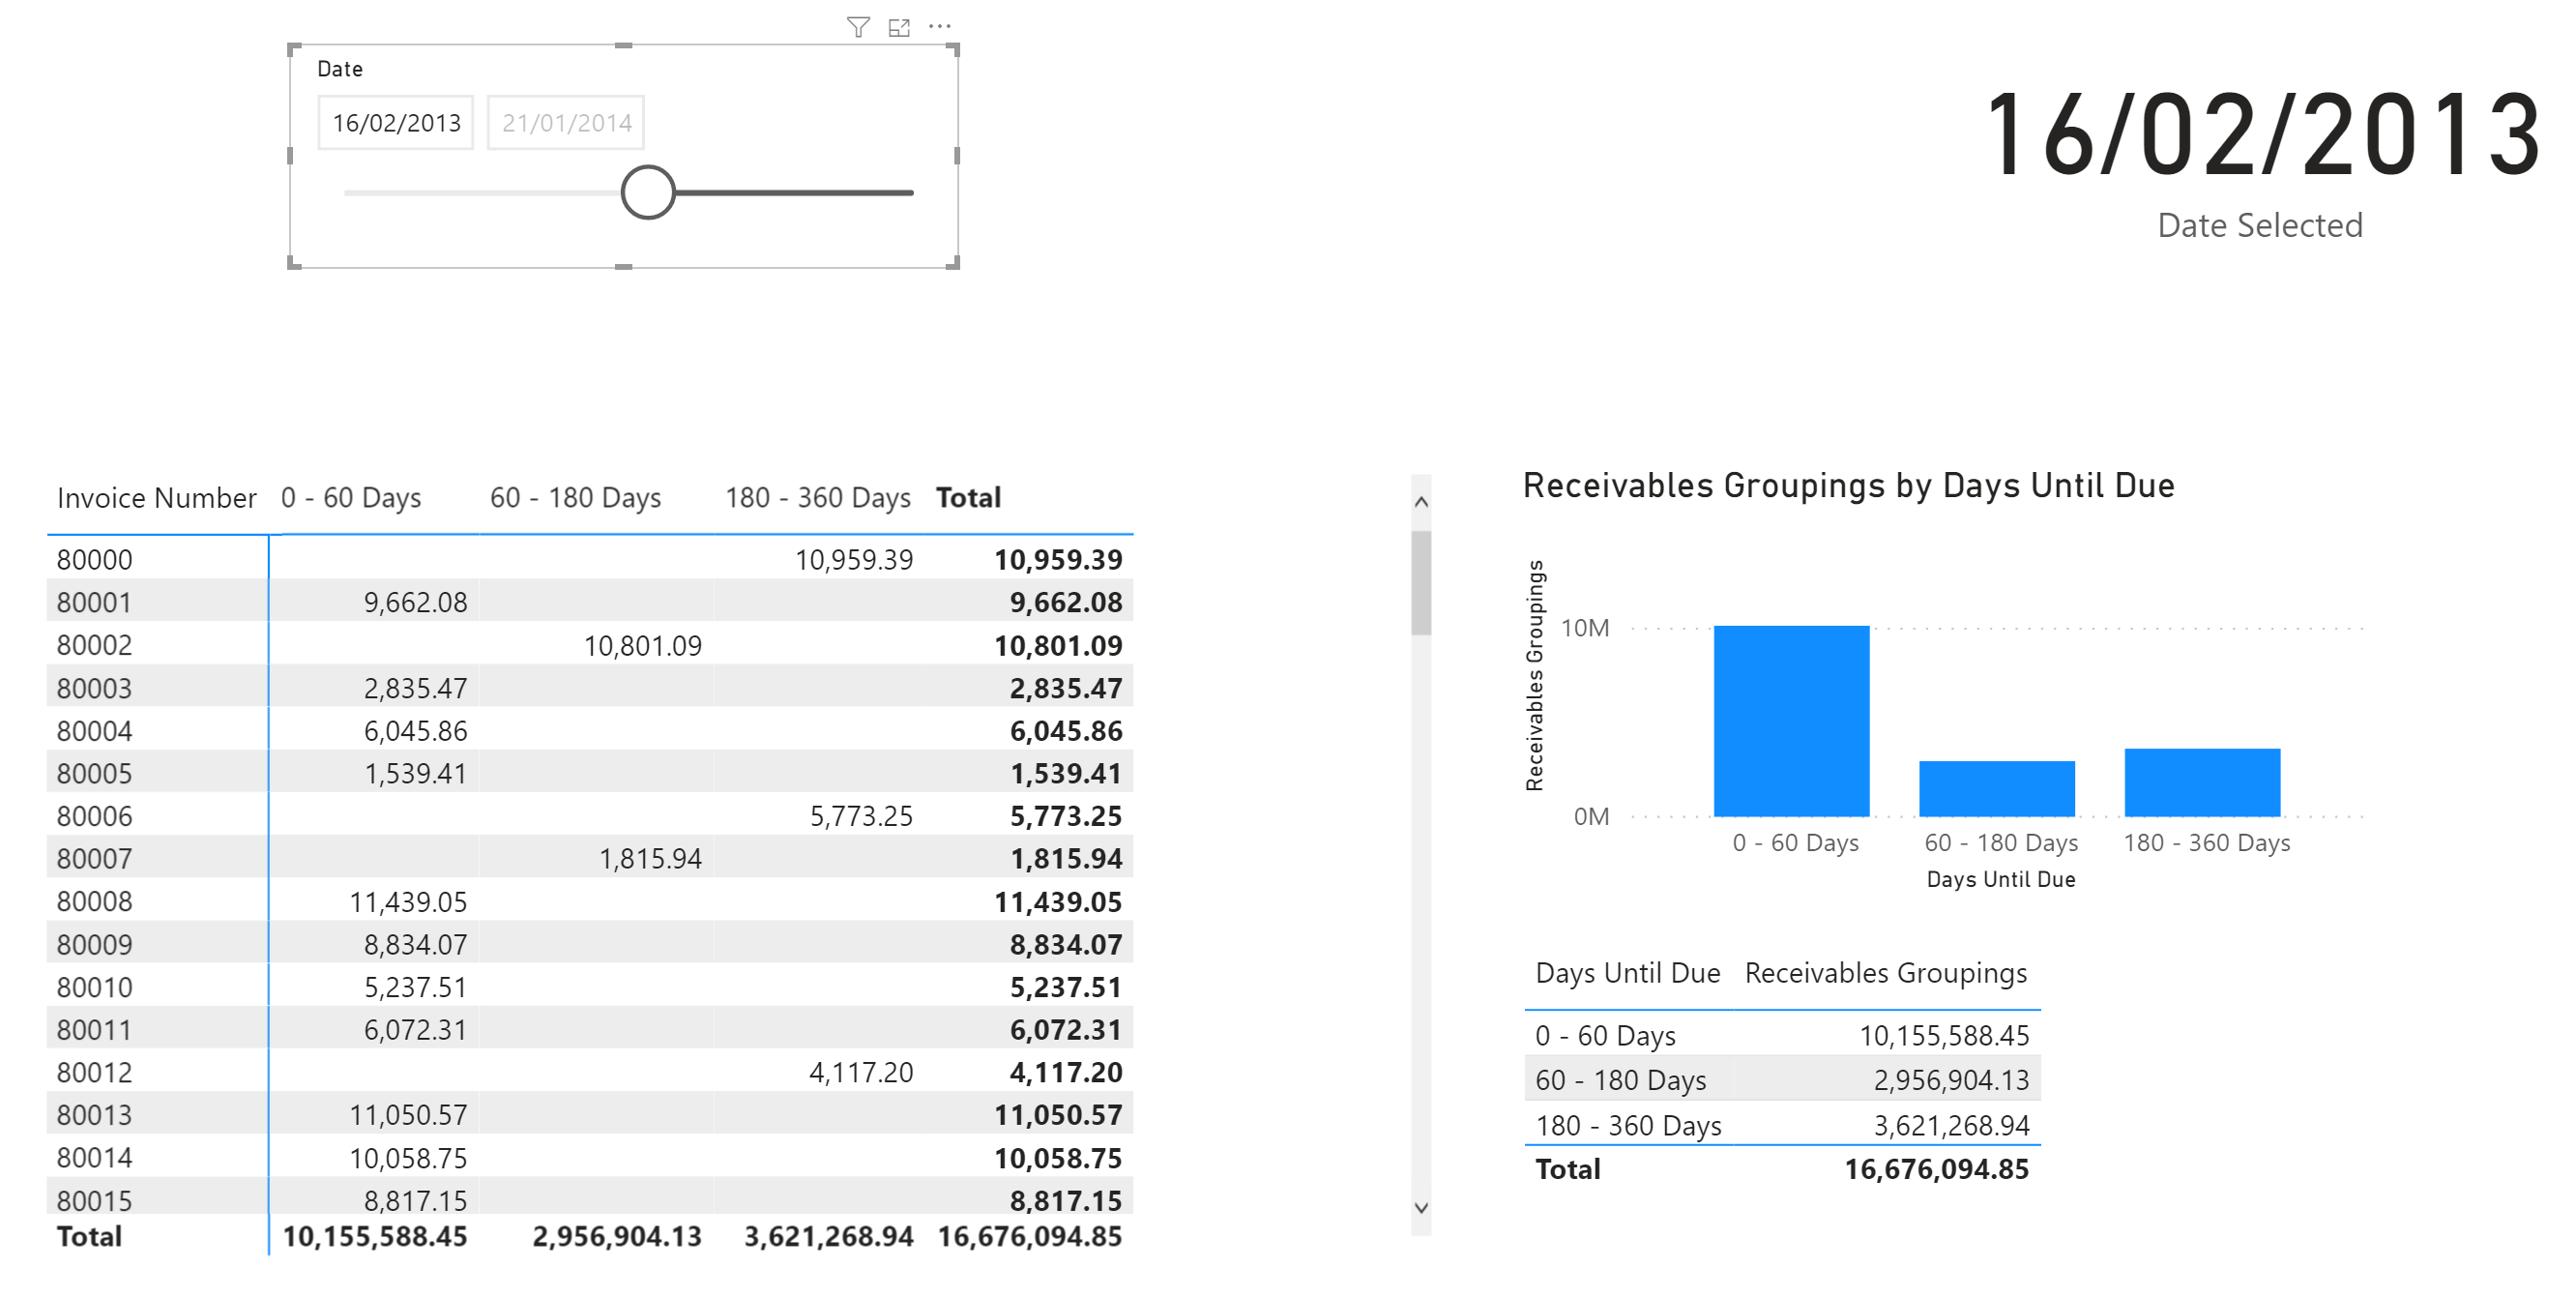
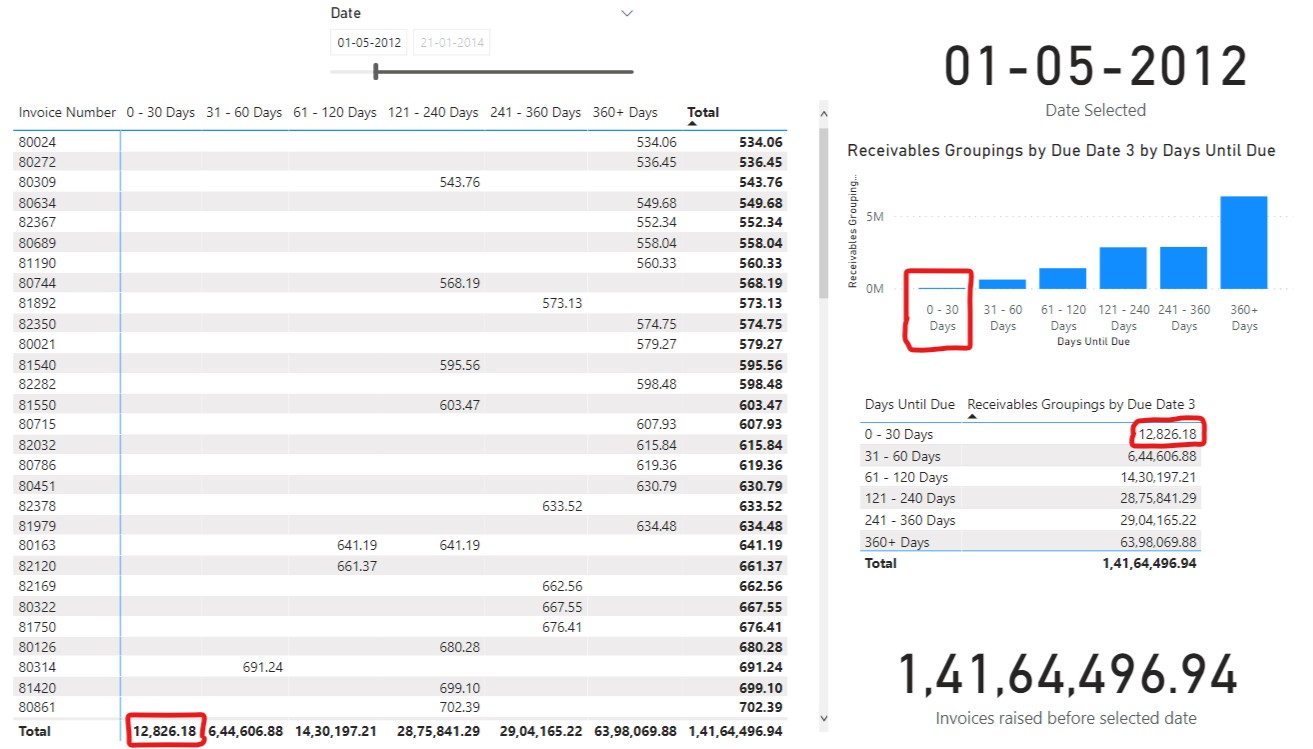
Now, you can observe that between 0 - 30 Days period also we’ve a value. Below is the screenshot provided for the reference -

I’m also attaching the PBIX file of the working for the reference.

Hoping this clears your doubt and meets your requirements. :slightly_smiling_face:

Thanks and Warm Regards,
Harsh

Attaching the revised file with proper formatting.

Dynamic Accounts Receivable - 3.pbix (271.7 KB)

1 Like

Hello @Harsh

Thank you for taking the time to help with this. I’ve certainly picked up a few things on the way which is greatly appreciated. I’m new to Power BI and therefore assistance such this goes a long way to improve my understand of the workings.

Thanks again and regards
Manoj

1 Like

Hello @M_K,

You’re Welcome. :slightly_smiling_face:

I’m glad I was able to help you.

Thanks and Warm Regards,
Harsh

1 Like

Harsh,

Would these calculations work in reverse order? As in if I wanted to go back a couple of months and view what was current at that selected day…so that receivables that may be in a category of 60 to 90 days a couple of months ago would be in the 0 to 30 days.