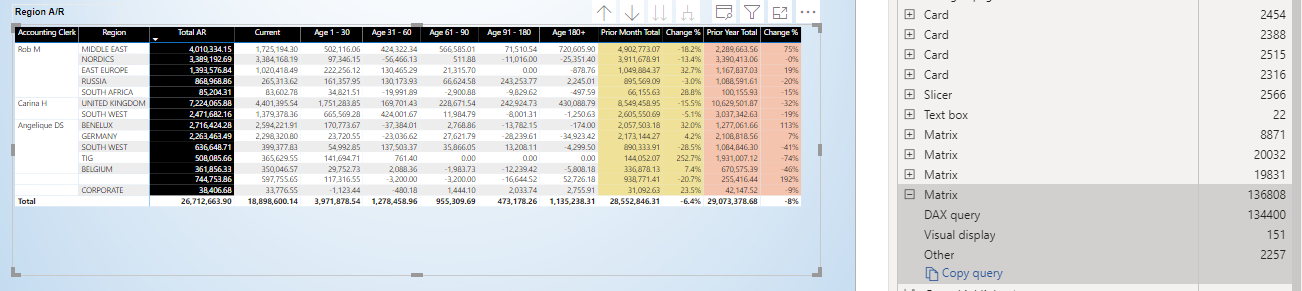
Could you please help with optimizing my DAX formulas ? Please focus on the bottom ‘Region A/R’-table, as that would be the formula logic I would like to stick to.
@dillenbram
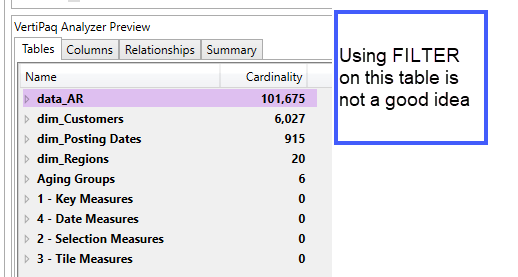
The main problem you are running into is that you are using FILTER over the data_AR table, which looks like a fact table with high cardinality (unique values). When you use filter, filter iterates whatever table you tell it. So in your formulas you are telling filter to iterate over this table over and over and over… See if you can find a way to have the filters start off in the smaller dimension tables and you can “Send” it to the the fact table.
How would it be possible to start off from a dimension table, knowing that the key of the resulting calculation lies in the interactive ‘Days left’-measure?
In order for the resulting table to stay ‘interactive’ ( = reacting ‘live’ to changes in the Date-slicer) , it does need to iterate through every single line from the ‘data_AR’-table: comparing Selected date vs. Due date for each line-item & calculating the ‘Days Left’-measure.
How would it be possible to keep the table interactive, if we would, like you suggest, start ‘grouping’ values in a dimension table & stop iterating through every single line for the ‘Days left’-measure calculation?
Its really interesting. The issue is clear here Measures using iterator function(Filter)
Matrix is taking more than 3 mins to load… definitely we’ve to improve the performance.
If we can create a calculated column for Days Left…Instead of Iterator we can use direct filter I think this is not possible, because this is depending on selected date from slicer.
We’ve to think different approach. Let us know if you got any idea.
@dillenbram
There’s a lot going on in that file for sure. Is there a way you can simplify what is going on here. It will take some time to untangle all the measures, It looks like everything is based on the Days Left measure and then Invoice Values as the aggregated values?
One thing that stood out is that it looks like your Dim_Posting Dates table isn’t related to the data_AR table. Filters work best using relationships. Can that table be related?
You are correct that you really cant store anything as a calculated column if you want to keep it dynamic and based on the slicer.
I’m thinking using some sort of combination of GROUPBY and CALCULATETABLE or maybe even creating another copy of the data_AR table, but slimmed down. Just some potential ideas.
Hi @dillenbram, we’ve noticed that no response has been received from you since the 10th of June. We just want to check if you still need further help with this post? In case there won’t be any activity on it in the next few days, we’ll be tagging this post as Solved. If you have a follow question or concern related to this topic, please remove the Solution tag first by clicking the three dots beside Reply and then untick the checkbox. Thanks!