Hi all,
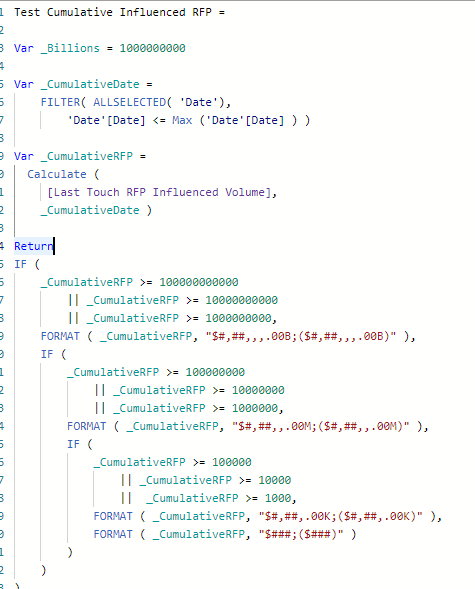
I have the following DAX formula, see image #1, that switches number format and it works in a table/matrix but when I want to view it via a graph it doesn’t work. Where am I going wrong?
Thanks
Hi all,
I have the following DAX formula, see image #1, that switches number format and it works in a table/matrix but when I want to view it via a graph it doesn’t work. Where am I going wrong?
Thanks
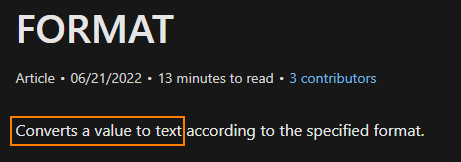
the issue you’re seeing is that FORMAT is actually returning a text type - not a number type:
To see the value in a chart, you need to have a separate measure that just returns a numerical value.
How would I do that? Just reference this measure in the new measure
For example like this:
Test RFP =
[Test Cumulative RFP]
Thanks Heather
No, I don’t believe that will work - because the old measure is still a text value.
Probably you will need to build the measure again, but without the FORMAT option. Just return a number value. In a chart, you don’t need the dollar sign, K, or M symbols - you just need the numbers.
if you need to have numbers show for data labels, you can control the M and K features in the Display Units option.
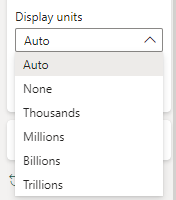
by default Display units is set to Auto (so it adjusts based on the data provided)
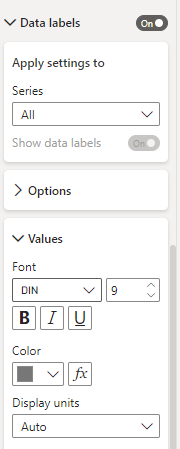
but you can force it to display differently as shown:
Your new measure would have the _CumulativeDate and _CummulartiveRFP VAR statements, but after the RETURN it would be just:
_CumulativeRFP
Thanks Heather for your response. Much appreciated. You are awesome!! ![]()
Hello @ysherriff ,
Did the response from @Heather (thank you) help solve your query?
If it did, please mark the answer as the SOLUTION by clicking the three dots beside Reply and then tick the check box beside SOLUTION
Thank you