Dynamic Number Formatting April Update

Hi team, I have been trying to use the new dynamic formatting function released in the April updates. The function allows the user to dynamically format a measure.

I have used the following code to be able to display millions and thousands in a graph.

var _salestotal = [test]
var _result = SWITCH( TRUE(),
_salestotal <1000,“#0”,
_salestotal <1000000,“#,.k”,
_salestotal >=1000000,“#,.m”)
return
_result

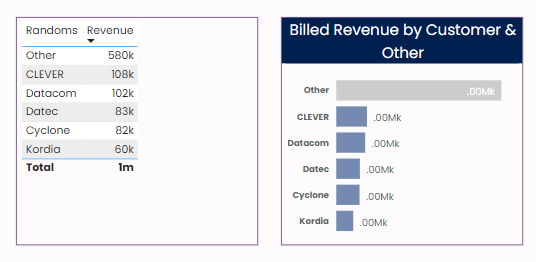
This is working when the data is represented in a table. When the visual is changed to a graph it isn’t working. Please see graphic below.

Has anyone else had this problem?

image

Hi @stevens

Did you down load the updated version?

Please remember the Dynamic number Formatting is in preview mode

Make sure you update the options Global “preview features” Dynamic format string for measures

Please see the following video
Show numbers in Thousands or Millions in same column with the new Dynamic formatting in Power BI - YouTube

PS…I don’t think that is option is available yet within a graph

i hope this helps.

Keith

1 Like

Bumping this post for more visibility from our experts and users.

Hi @stevens

We noticed that your inquiry was left unsolved for quite some time now.
Looks like your inquiry was out of the experts’ and users’ bounds.

If you were sure you provided all pertinent context to your concerns and read how to use the forum more effectively and still find your question unanswered, your membership also comes with relevant resources that may help you with your Power BI education, so we advise that you check these resources as well.

While our users and experts do as much as reasonable to help you with your inquiries, not all concerns can be attended to especially if there are some learnings to be done. Thank you!