Dynamic/Multi-level Granularity Subtotals

Hello,

I had question about combining data at different granularities side by side.

I came across this blog,

which I thought would help me solve the issue, but I couldn’t figure it out. I wasn’t sure if it has something to do with the calculations being based on dates.

My problems are.

  1. Creating a matrix with customer and date, having the fiscal year totals following the last month of the year.
  2. Creating a slicer to be able to toggle between the view
    A) Just Months
    B) Just Fiscal Years
    C) Both months followed by FY Total

I created a template using Sam’s methodology. I know the many to many relationship is bad, but wasn’t sure how to fix that either with trying to create a model to accomplish my issue.

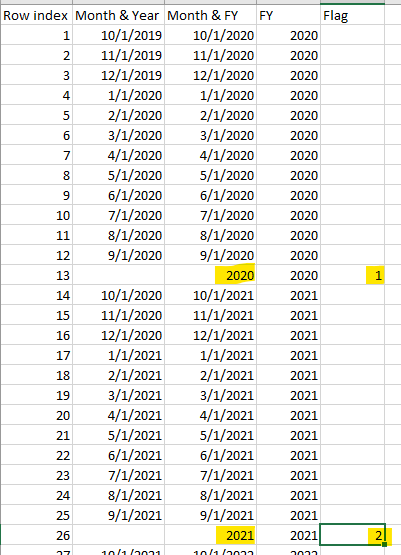
By creating the table I was able to get the columns to populate correctly.

You can see how after 9/2021, the year 2021 shows up in the next column. This was built into my template.

Unfortunately when I bring in the customer and the values, the year column disappears.

Not really sure what the solution is. Wondering if anyone has ever had to do this and if there is an easier way to do it.

The granularity of my date is by the month in the AdaptiveInsights date, so I don’t know if adding a date table will help unless I can bring the granularity of the table down to the day.

Attached is my tables and power bi file. Appreciate any suggestions.

Adaptive Insights example.pbix (225.6 KB)

Adaptive Customers Date Template.xlsx (9.8 KB)

Adaptive Customers example.xlsx (16.9 KB)

AdaptiveInsights example.xlsx (385.8 KB)

Thank you.

Hi ibesmond,

Revised version 3, including reports with a workable workaround of the slicer request hopefully.

Better only use one to many relationships, you do not need it at all, remember the waterfall principle .

See the attached PBIX file with a setup, whereby a date table including FY Month is then connected to the Adaptive Value table.
I only made one measure Total Sales = SUM( ‘2eInsights’[Value] )

I faced a problem that not all of the dates from the Insights table were matched to the Date table, (dates in the Insight table appears to have a date time format, the date table has a date format) which resulted that not all customers were listed in the report. I solved this with using the formula Trim for the column Month in the Insights Table, and make a new date out of the derived number per row, see the new columns in the Insight table.

The date table can be filled as below:

Insight Customers with a TimeTable3.pbix (217.3 KB)

I hope you can work with the reports as built so far.

Let me know any comments.

Kind regards,

Thanks @deltaselect,

This is helpful, but not exactly what I am trying to accomplish.

I attached an excel copy of some mock data (not the original data set) just to show the format which I am trying to convey.

Basically one table: Month, Month, Month, Month, Month, etc, Year, Month, Month, Month, Month, etc Year.

With a toggle or slicer to remove the months or the years.

Creating separate visuals it not the issue. Its getting one function to add up the month, then add up the fiscal year all in one table.

Excel example.xlsx (139.4 KB)

I color coded it to emphasize the desired format.

hi ibesmond,

Interesting topic, will have a look into.
Hopefully I am able to come up with something.
Kind regards,

1 Like

I wanted to add some closing to this to share with others and @deltaselect
A consultant helped us with the solution.

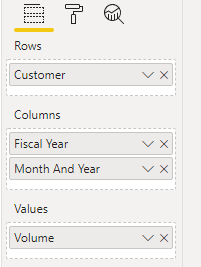
In the matrix you need to add another layer to the columns.

I added fiscal year on top of my month and year column.

Set up

You then need to configure the visual by selecting the down arrow that splits.

down arrow split

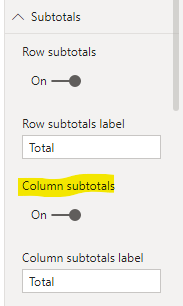
Next you need to go to formatting and make sure the column subtotals are on.

image

Then it should be all set up to display correctly.

Hope this helps others in need. I thought the solution was going to be much more difficult, though I questioned why a simple subtotal wouldn’t be a built in function. The function is built in, but you need to add the yearly level and drill down to get the subtotal to appear.

As they say: simplicity is the key to success.

Hi ibesmond,

I absolutely agree, simplicity is key to success, adding a Year and Months in the columns sounds perfectly suited.

Regardless, I still want to show you a workout I made, see attached PBIX.
For me, it was very interesting to learn / experience the toggle principle and report setup.

Insight Customers with a TimeTable5.pbix (210.3 KB)

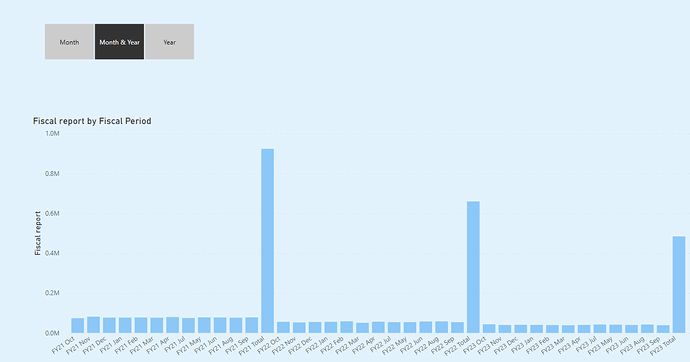
It includes the requested toggle, switch between FY, Months and FY+ Months. ( required code learnt from a report “Management Insights”, which uses Metrics from Enterprise DNA)
To use this toggle in NEW visuals, be aware to use the measure “Fiscal Report” in the --Value-- of the visual, instead of “Total Sales”.

It also includes (the principle of) a report layout of fiscal periods months, full year, for 3 years, see table “Report Layout”, containing the FY periods and an index, and corresponding measures Fiscal Months, Fiscal Months & Years and Fiscal Years.

Sorting: To make sure the reports show the months in the right sequence (not like apr 21, aug21,), in the table Report Layout the Financial Period needs to be sorted by Index. (maye even sorting the column FY Month by monthnnyear in the date table)

I could not find the way to create empty lines after the year totals, however it is defined in the ReportLayout table with the words StartFY21, 22, 23, 24on line 1, 15,29 and 48 (those gives none values, but empty lines are not presented in the reports, setting ?)
And Bold numbers for FY totals should be a nice feature.

Kind regards, deltaselect

1 Like

@deltaselect

This is exactly what I was looking for. My “work around” provided the same information, but instead of using a slicer I had to create 3 tables and overlay them. Then use the ability of buttons and bookmarks to change the table being displayed by hiding or revealing the tables.

Thanks for taking a second look at this. I’m going to try and incorporate your methodology into my report. It requires less configuration and change of mistakes, if I share the report with someone not familiar with buttons and bookmarks.

:+1: :smile: