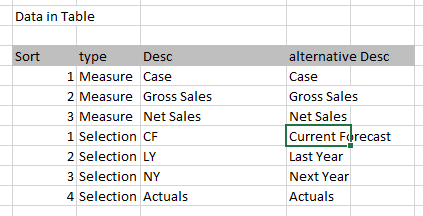
we are stuck in how should we design this if we have a single table as below
I have a tab with 2 visuals one table which shows Monthly data and one line chart for the same.
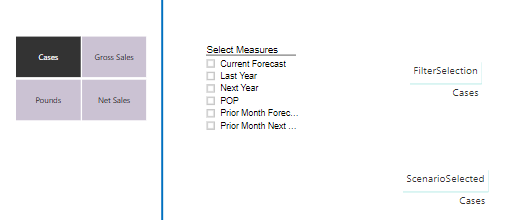
we have to make 2 slicers on same page as below
1, Type = Measure and show Desc values ( this will be used to dynamically change all the values on page( both line chart and Table values) for example If user selects Case show values in Cases, similarly is user selects Gross Sales show all the Sales Value.)
Type = Selection and show Alternative Desc values ( this will be used to dynamically change the line chart values base on selection by the user.)
When I am selecting Case or Sales the table values are changing but line chart is coming blank. For line Chart there are 2 filters… one is the case and second is Selection value. As soon as I select Case the alternative desc also comes Case and the line chart is not getting values.
Is it possible to use the same table or do we need to create 2 tables.
Probably going to see an example I think to see all the variables at play here.
Are you sure you also just couldn’t simplify this and make two tables instead of the one. It seems to me that would solve a lot of these problems quite quickly.
Finally started using 2 tables instead of one. Just duplicated the same table twice. It seems like when ever I am selecting a value from second table slicer say Current forecast … nothing is coming on line chart. Looks like I am still missing something here.
The second table slicer is multi select means based on selection the lines will appear on line chart like current forecast, last year. If there is no selection then all the lines will appear.
I think this is the way to go. Just make it simple on yourself if it’s easiest enough to do. When you have many slicer on a page it’s better to have separate table. I show a similar example here with dates.