Hello,
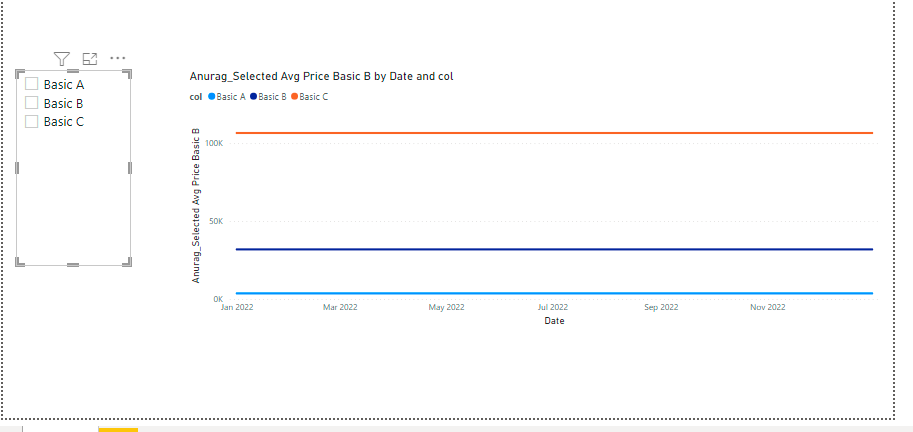
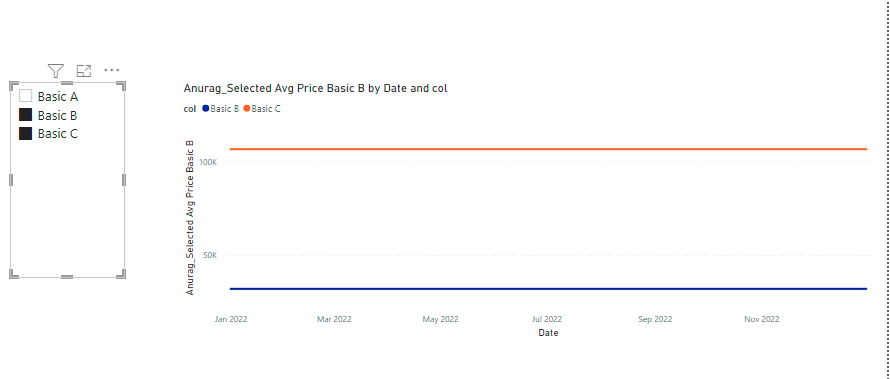
I am trying to create a dynamic line chart with dynamic lines on the values. Like in the pictures:
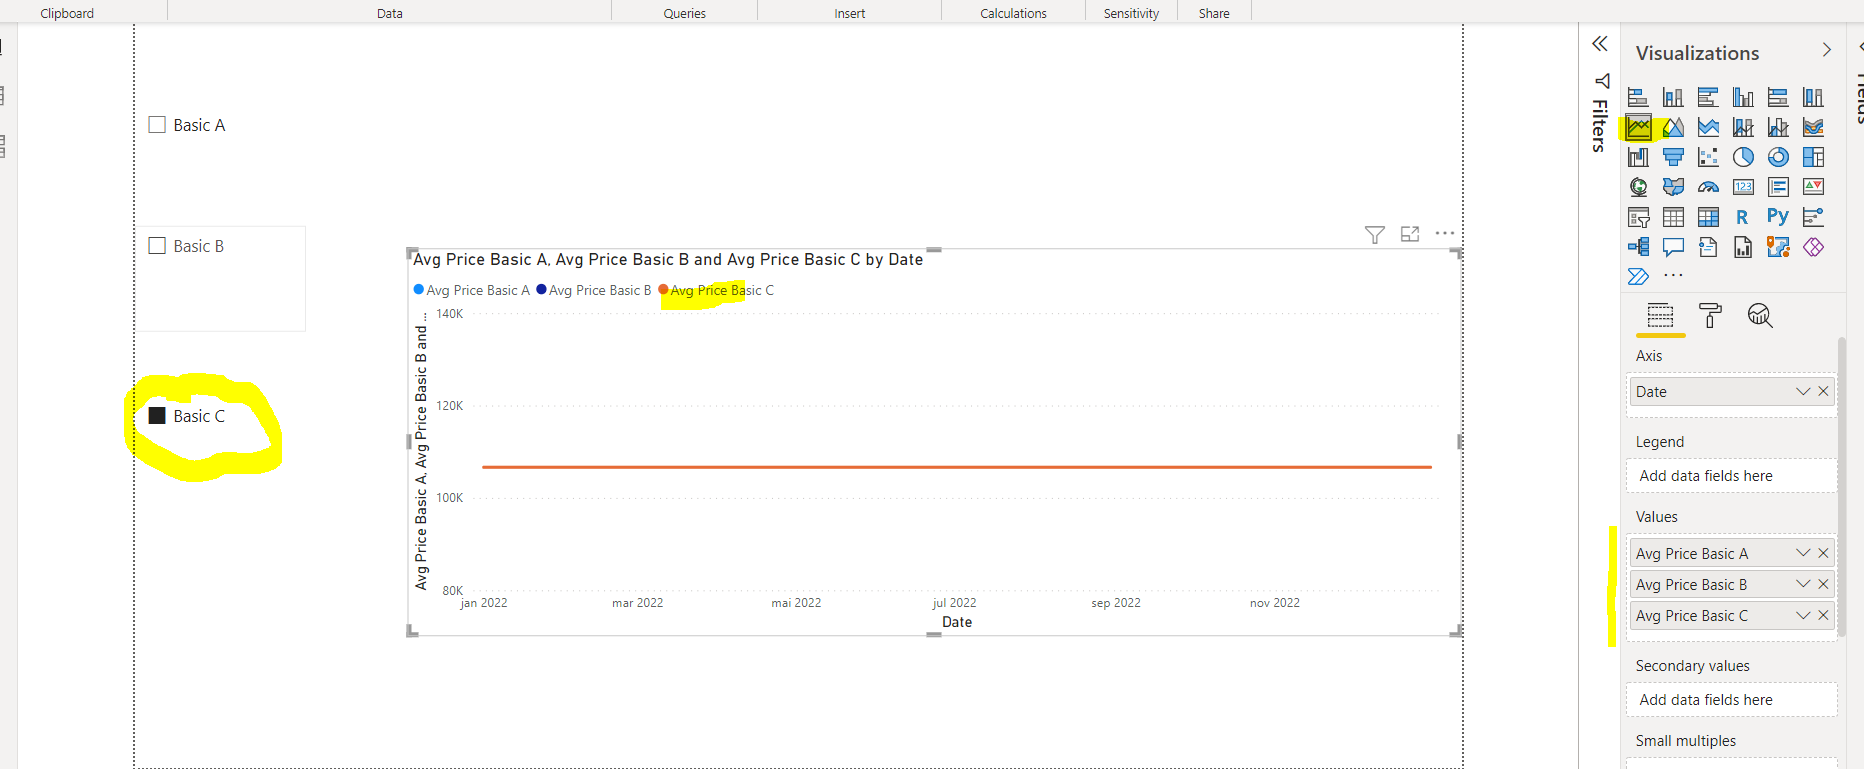
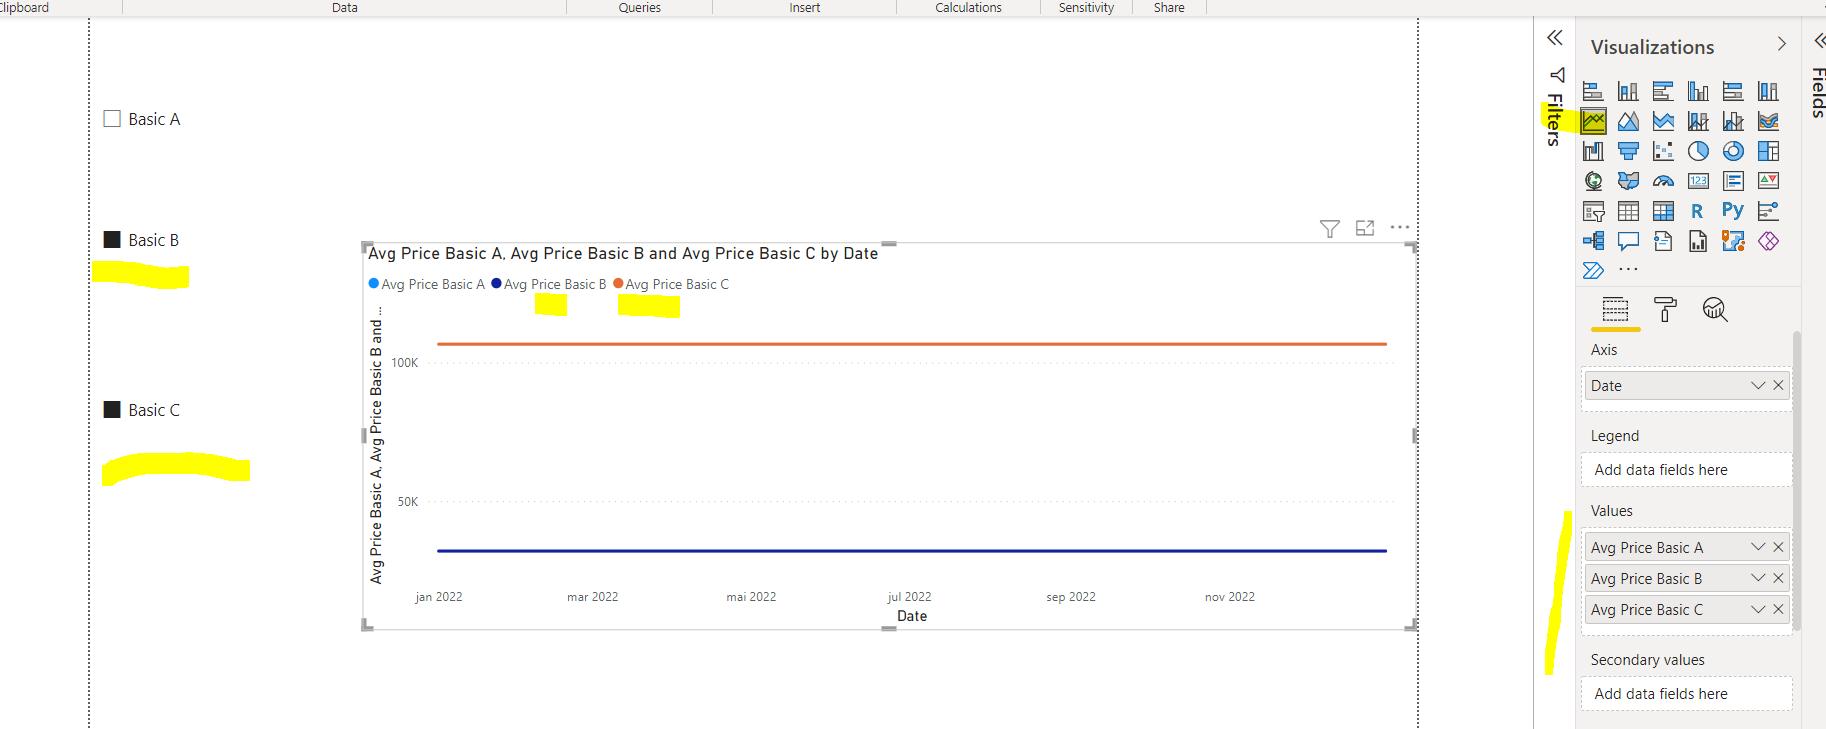
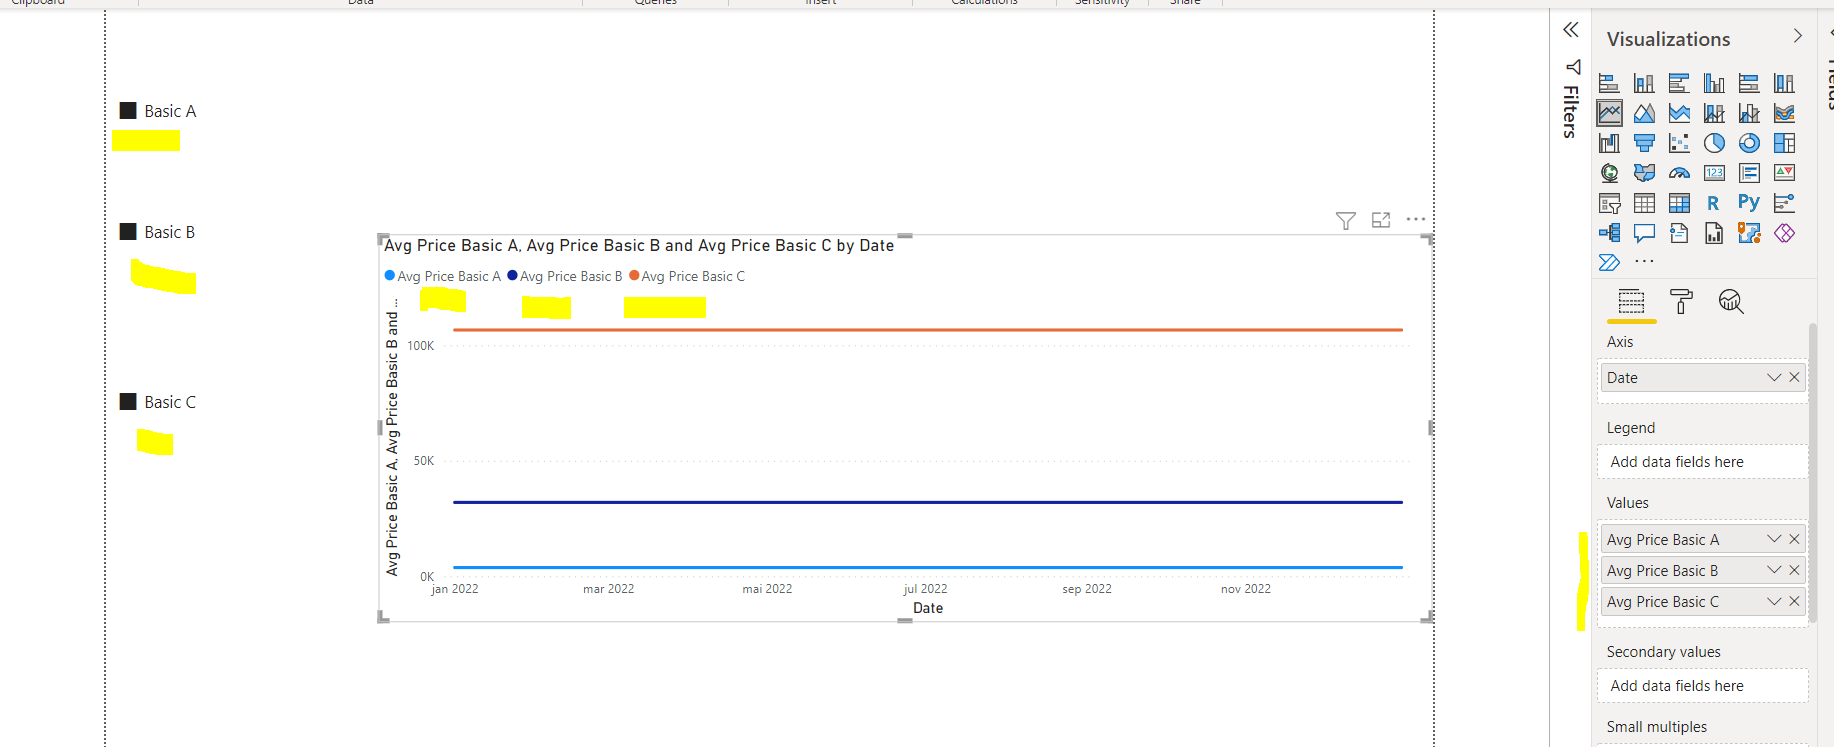
As you see in the pictures I managed to do it already however, I am not fully satisfied with both the creation of extra tables and the DAX used.
To create this graph I created three extra tables that have two rows each, one for the real name I was going to use, and one that is just named “other”. Like in the picture:
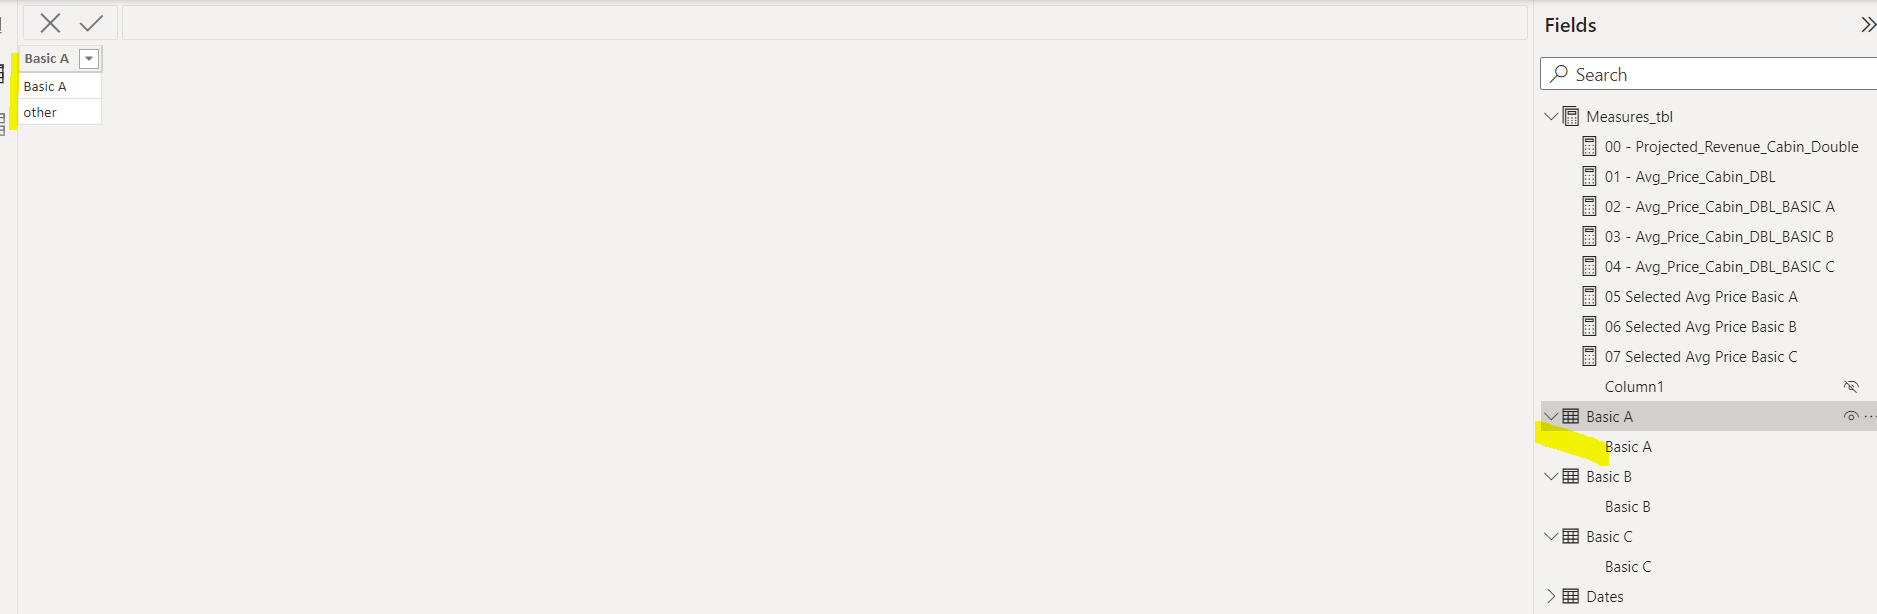
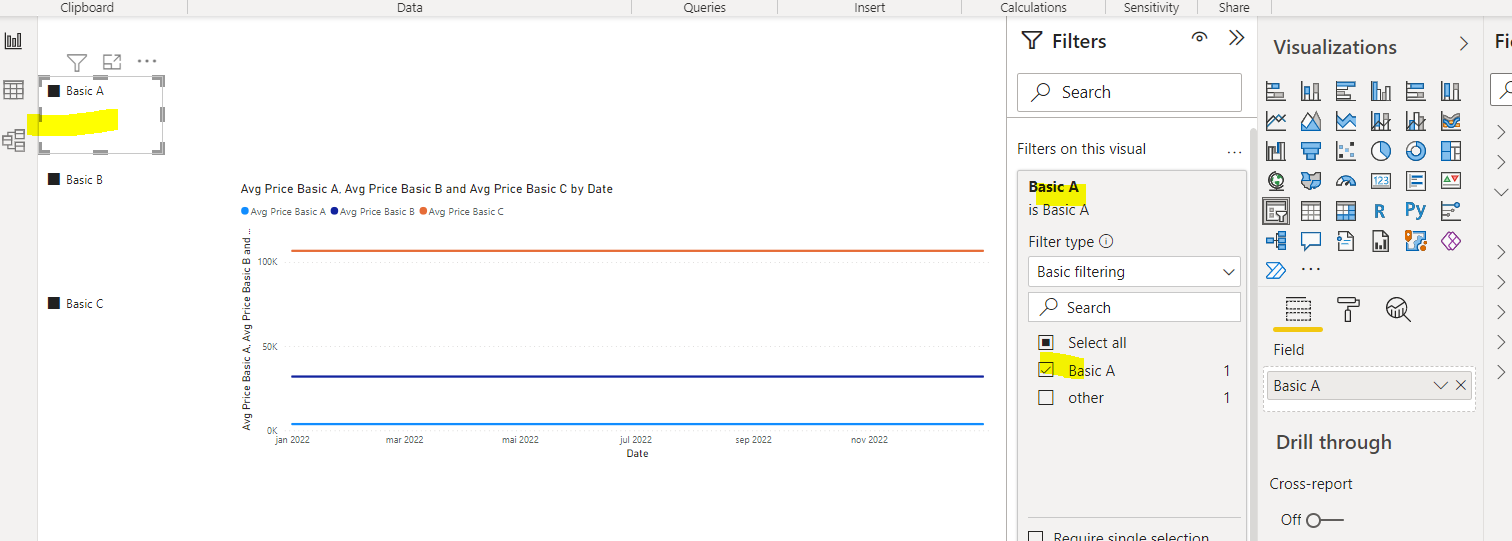
I created a slicer based on Basic A row and I filtered out the “other” row.
And this is what the measure looks like for Basic A prices:
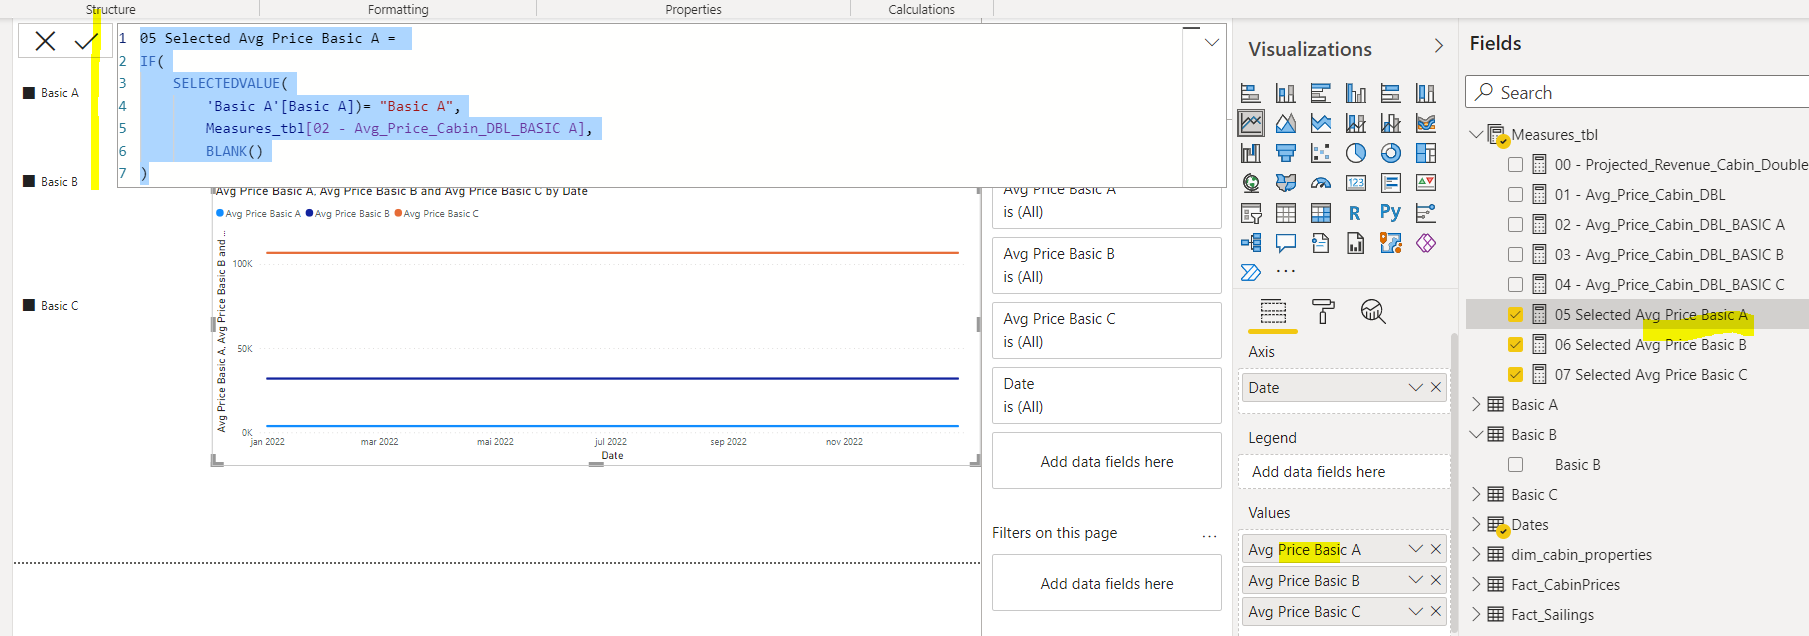
The solutions for Basic B and Basic C are identical.
My questions are the following:
- Is it possible to solve these dynamic lines another way? For example with one table, used as a slicer (multiple choices allowed),
- If yes, what will the measures look like?
- I didn’t go for bookmarks as I have 8 different lines in the real dataset and the number of bookmarks will be huge.
Here is the Power Bi file attached:
DemoModel.pbix (197.8 KB)
Any help is greatly appreciated!