Dynamic Grouping - Last Month Value

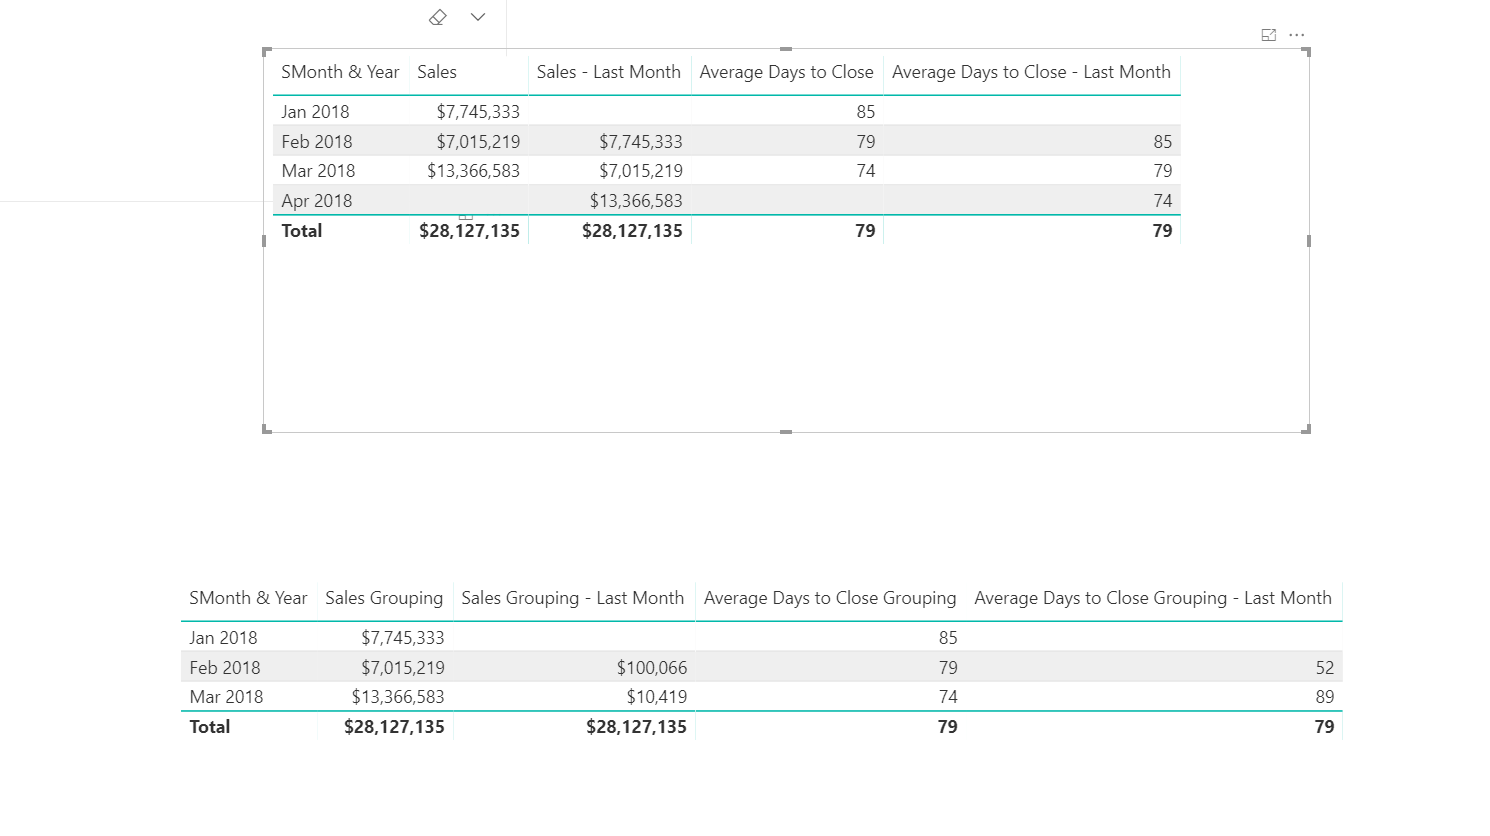
Hoping someone can point me in the right direction here. I have a need to group my data and have successfully done so with dynamic grouping. What I need now is to have that dynamic grouping work with a measure that is calculating for Last Months value.

I have:

Sales = SUM( Data[Total Selling Price] )

Sales - Last Month = CALCULATE(
    [Sales], DATEADD( Dates[Date], -1, MONTH ))

Sales Grouping = 
CALCULATE(  [Sales],
    FILTER(
        VALUES( 'Data'[Total Selling Price]),
            COUNTROWS(
                FILTER( 
                    'Groups',
                    'Data'[Total Selling Price] > 'Groups'[Min]
                    && 'Data'[Total Selling Price] <= 'Groups'[Max] ) )
                    > 0 ) )

And

Sales Grouping - Last Month = 
CALCULATE(  [Sales - Last Month],
    FILTER(
        VALUES( 'Data'[Total Selling Price]),
            COUNTROWS(
                FILTER( 
                    'Groups',
                    'Data'[Total Selling Price] > 'Groups'[Min]
                    && 'Data'[Total Selling Price] <= 'Groups'[Max] ) )
                    > 0 ) )

When I use the grouping measures, the LM values do not seem to match what I am expecting to see.

Is it possible to show values for Last Month with dynamic grouping?

Yes this definitely is possible.

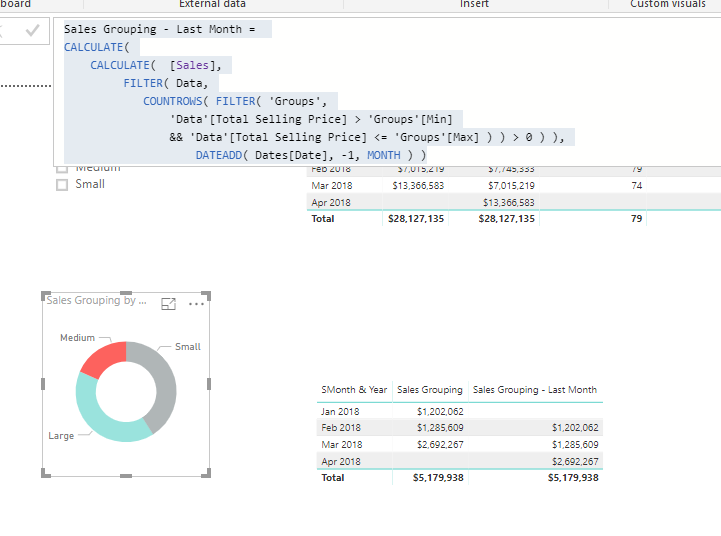
I actually went through a technique just like this during the latest summit.

Arround the 26min mark

The problem think you have here is you may have forgotten about the context of the calculation on the sales last month.

Is it possible to share a pbix or a sample?

To me you’re iterating through the selling price, which seems a little odd. Shouldn’t that be products? Are you looking to groups your products? or something else?

Ok great, thats great news, one of my team members just attended your latest summit after we got him a membership here

I’m actually just looking to group based on total sale value. The long term goal is to show the Total # of Open line items per value group in a given month compared to the average time to close items of the same value previous month. So my sales values groups are essentially <50K, <100K and >100K . I can do this by creating individual measures for each scenario, but I’d rather use dynamic grouping and have the ability to give the end user a slicer for <50K, <100K, >100K via the supporting groups table.

I’m able to do current year, but yes, I am confused on context for previous month. My standard previous month measure works. I’ll take a look at the video

Attached is a sample PBIX and sample source dataEDNA Grouping.pbix (166.2 KB)
EDNA Grouping.xlsx (33.1 KB)

It’s an interesting one.

I believe it’s due to the table that you need to iterate through here to get the answer.

This solves it for you though

Sales Grouping - Last Month = 
CALCULATE(
    CALCULATE(  [Sales],
         FILTER( Data,
            COUNTROWS( FILTER( 'Groups',
                'Data'[Total Selling Price] > 'Groups'[Min]
                && 'Data'[Total Selling Price] <= 'Groups'[Max] ) ) > 0 ) ),
                    DATEADD( Dates[Date], -1, MONTH ) )

So it seems you have to wrap the time intelligence around the pattern rather than have it inside.

See how you go with this

Ok, that makes sense, the sales measure will already be presented a table with the correct date range. That gets me exactly what I need. Thanks Sam