Very clever approach. Great point that while typically dummy variables are coded 0/1, there’s absolutely no reason why you can’t relax that assumption for cases like this one. Shows the flexibility of expressing them as numbers, rather than T/F.
Any ideas of how we could bring in a legend? For example, using a classification from the BCG Matrix:
1 would be the intersect of high sales rank and high margin products, more like “Stars”
2 would be the intersect of low sales rank and high margin products, say “Question Marks”
3 would be the intersect of high sales rank but low margin products, which are “Cash Cows”
4 would be the low sales rank and low margin products, “Dogs”
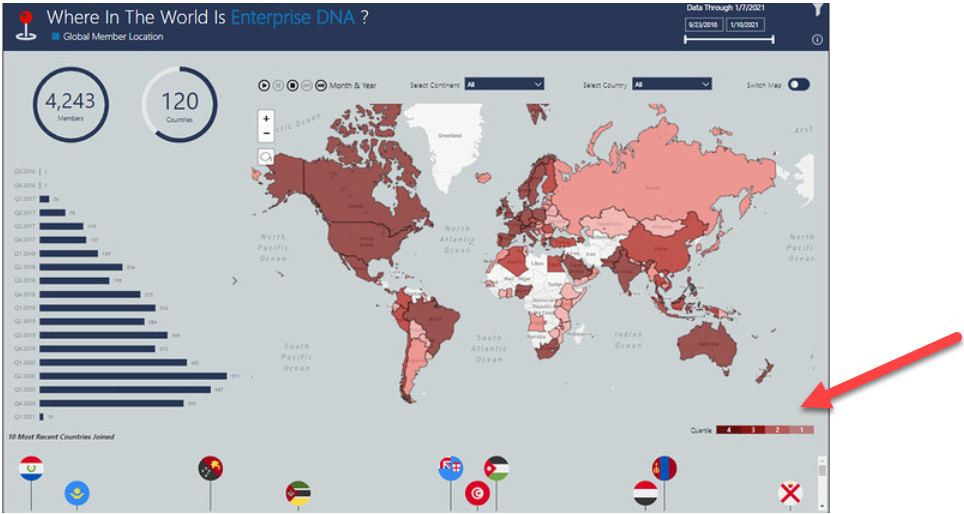
This is actually composed of four separate one cell tables, each one tied to a separate condition in the filter pane ( [Quartile] = 1, [Quartile] = 2, etc.).
It’s a bit fiddly getting all the table visuals lined up and looking like a single visual, but I think the final effect is great. Looping in @MudassirAli to see if he has any additional advice.
This is the only way I could think of building Dynamic Custom Legends. The other way would be to use bookmarks but still not better than the trick I used in this map. The solution which @Harvey is looking for can be best achieved with the Table Visual trick used to build the custom legend. You can surely let us know if you need help.