Hello @AliB,
Thank You for posting your query onto the Forum.
The results that you’re trying to analyze based on the solution which I had provided in the previous post is not applicable in the current scenario. The reason being is, you’re trying to use the results of “Measures” from previous scenario as “Fields” in the current scenario which cannot happen.
Power BI doesn’t allow to drag the “Measures” into the “Fields or Dimensions” section. And therefore, in order to achieve the results based on the condition that you’re specifying, you’ll be required to perform the transformations inside the Power Query thereby allotting the criteria’s to each and every row level which in turn can be used as a field. Below is the M Code alongwith the screenshot of the final results provided for the reference -
let
    Source = Excel.Workbook(File.Contents("HBS:\Forum\Quber\Doc\DataModel - Copy.xlsx"), null, true),
    #"Sales Data_Sheet" = Source{[Item="Sales Data",Kind="Sheet"]}[Data],
    #"Promoted Headers" = Table.PromoteHeaders(#"Sales Data_Sheet", [PromoteAllScalars=true]),
    #"Changed Type" = Table.TransformColumnTypes(#"Promoted Headers",{{"Group", Int64.Type}, {"Name", type text}, {"SalesDate", type date}, {"Sales", type number}}),
    #"Grouped Rows" = Table.Group(#"Changed Type", {"Group"}, {{"FullTable", each _, type table [Group=nullable text, Name=nullable text, SalesDate=nullable date, Sales=nullable number]}}),
    #"Added Custom" = Table.AddColumn(#"Grouped Rows", "Custom", each

    let
        AllDataTable = [FullTable],

        Prev =
        Table.AddColumn(
            Table.AddColumn(
                Table.AddColumn(AllDataTable, "Month & Year", each Date.ToText([SalesDate], "MMM yyyy")),
            "PreviousSalesDate", each Date.AddYears([SalesDate], -1)),
        "Previous Month & Year", each Date.ToText([PreviousSalesDate], "MMM yyyy"), type text),

        NestedJoin =
        Table.NestedJoin(Prev, {"Group", "Previous Month & Year"}, Prev, {"Group", "Month & Year"}, "AddedColumn", JoinKind.LeftOuter)

    in
        NestedJoin),

    Custom1 = Table.Combine(#"Added Custom"[Custom], {"Group", "Name", "SalesDate", "Sales", "AddedColumn"}),
    #"Expanded AddedColumn" = Table.ExpandTableColumn(Custom1, "AddedColumn", {"Sales"}, {"Previous Sales"}),
    #"Sorted Rows" = Table.Sort(#"Expanded AddedColumn",{{"Group", Order.Ascending}, {"SalesDate", Order.Ascending}}),
    #"Merged Queries" = Table.NestedJoin(#"Sorted Rows", {"Group"}, Customers, {"Group"}, "Customers", JoinKind.LeftOuter),
    #"Expanded Customers" = Table.ExpandTableColumn(#"Merged Queries", "Customers", {"OnboardingDate", "End Date"}, {"OnboardingDate", "End Date"}),
    #"Grouped Rows1" = Table.Group(#"Expanded Customers", {"Group"}, {{"FullTable", each _, type table [Group=nullable number, Name=nullable text, SalesDate=nullable date, Sales=nullable number, Previous Sales=nullable number, OnboardingDate=nullable date, End Date=nullable date]}}),
    Custom2 = Table.TransformColumns(#"Grouped Rows1", {{"FullTable", each Table.AddIndexColumn(_, "Index")}}),
    #"Added Custom1" = Table.AddColumn(Custom2, "Custom", each

    let
        AllDataTable = [FullTable],

        Prev =
        Table.AddColumn(
            Table.AddColumn(AllDataTable, "Status", each
                if Date.Year([SalesDate]) = Date.Year([OnboardingDate]) and Date.Year([SalesDate]) = Date.Year([End Date]) then "Lost"
                else if Date.Year([SalesDate]) = Date.Year([OnboardingDate]) then "Won"
                else if Date.ToText([SalesDate], "MMM yyyy") = Date.ToText([End Date], "MMM yyyy") then "Lost" else null),
            "Date", each
            if Date.ToText([SalesDate], "MMM yyyy") = Date.ToText([OnboardingDate], "MMM yyyy") then [OnboardingDate]
            else if Date.ToText([SalesDate], "MMM yyyy") = Date.ToText([End Date], "MMM yyyy") then [End Date] else [SalesDate]),

        LostCalc =
        Table.AddColumn( Prev, "Lost Calc", each
            if Date.ToText([SalesDate], "yyyy") = Date.ToText([End Date], "yyyy") then "Lost" else [Status]),

        PrevStatus =
        Table.AddColumn(
            Table.FillDown(
                Table.AddColumn(
                    Table.AddColumn(
                        Table.AddColumn(LostCalc, "Prev Status", each
                            try LostCalc [Lost Calc] {[Index]-1} otherwise null),
                        "Not A Customer Status", each if [Lost Calc] = null and [Prev Status] = "Lost" then "Not A Customer" else [Lost Calc]),
                    "Abc", each
                    try if ([Sales] - [Previous Sales]) <= 0 then "Shrinkage"
                    else if ([Sales] - [Previous Sales]) > 0 then "Growth" else null otherwise null),
                {"Not A Customer Status"}),
            "Customer Status", each if [Abc] = null and [Not A Customer Status] = "Won" then "Won"
            else if [Abc] = null and [Not A Customer Status] = "Lost" then "Lost"
            else if [Not A Customer Status] = "Lost" then "Lost"
            else if [Not A Customer Status] = "Not A Customer" then "Not A Customer"
            else [Abc])

    in
        PrevStatus),

    Custom3 =
    Table.TransformColumnTypes(
        Table.Combine(#"Added Custom1"[Custom], {"Group", "Name", "Date", "Sales", "Customer Status"}),
    {{"Group", type number}, {"Name", type text}, {"Date", type date}, {"Sales", type number}, {"Customer Status", type text}})
in
    Custom3
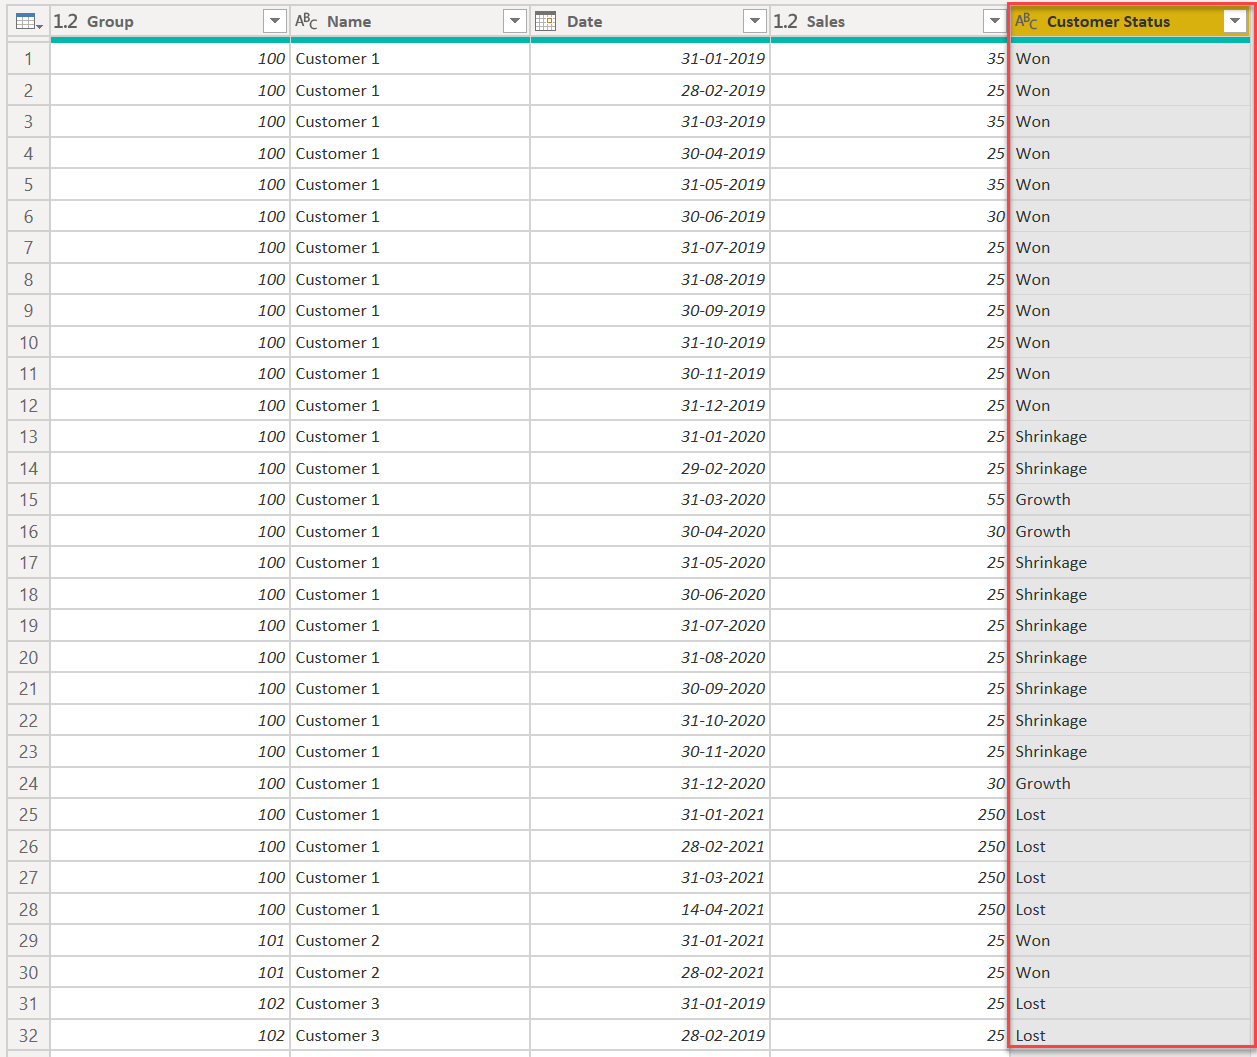
After performing this level of transformation, this is how the Sales Table will look like with the additional column of “Customer Status” -
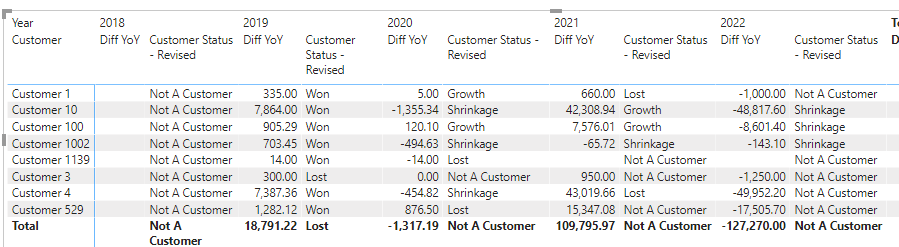
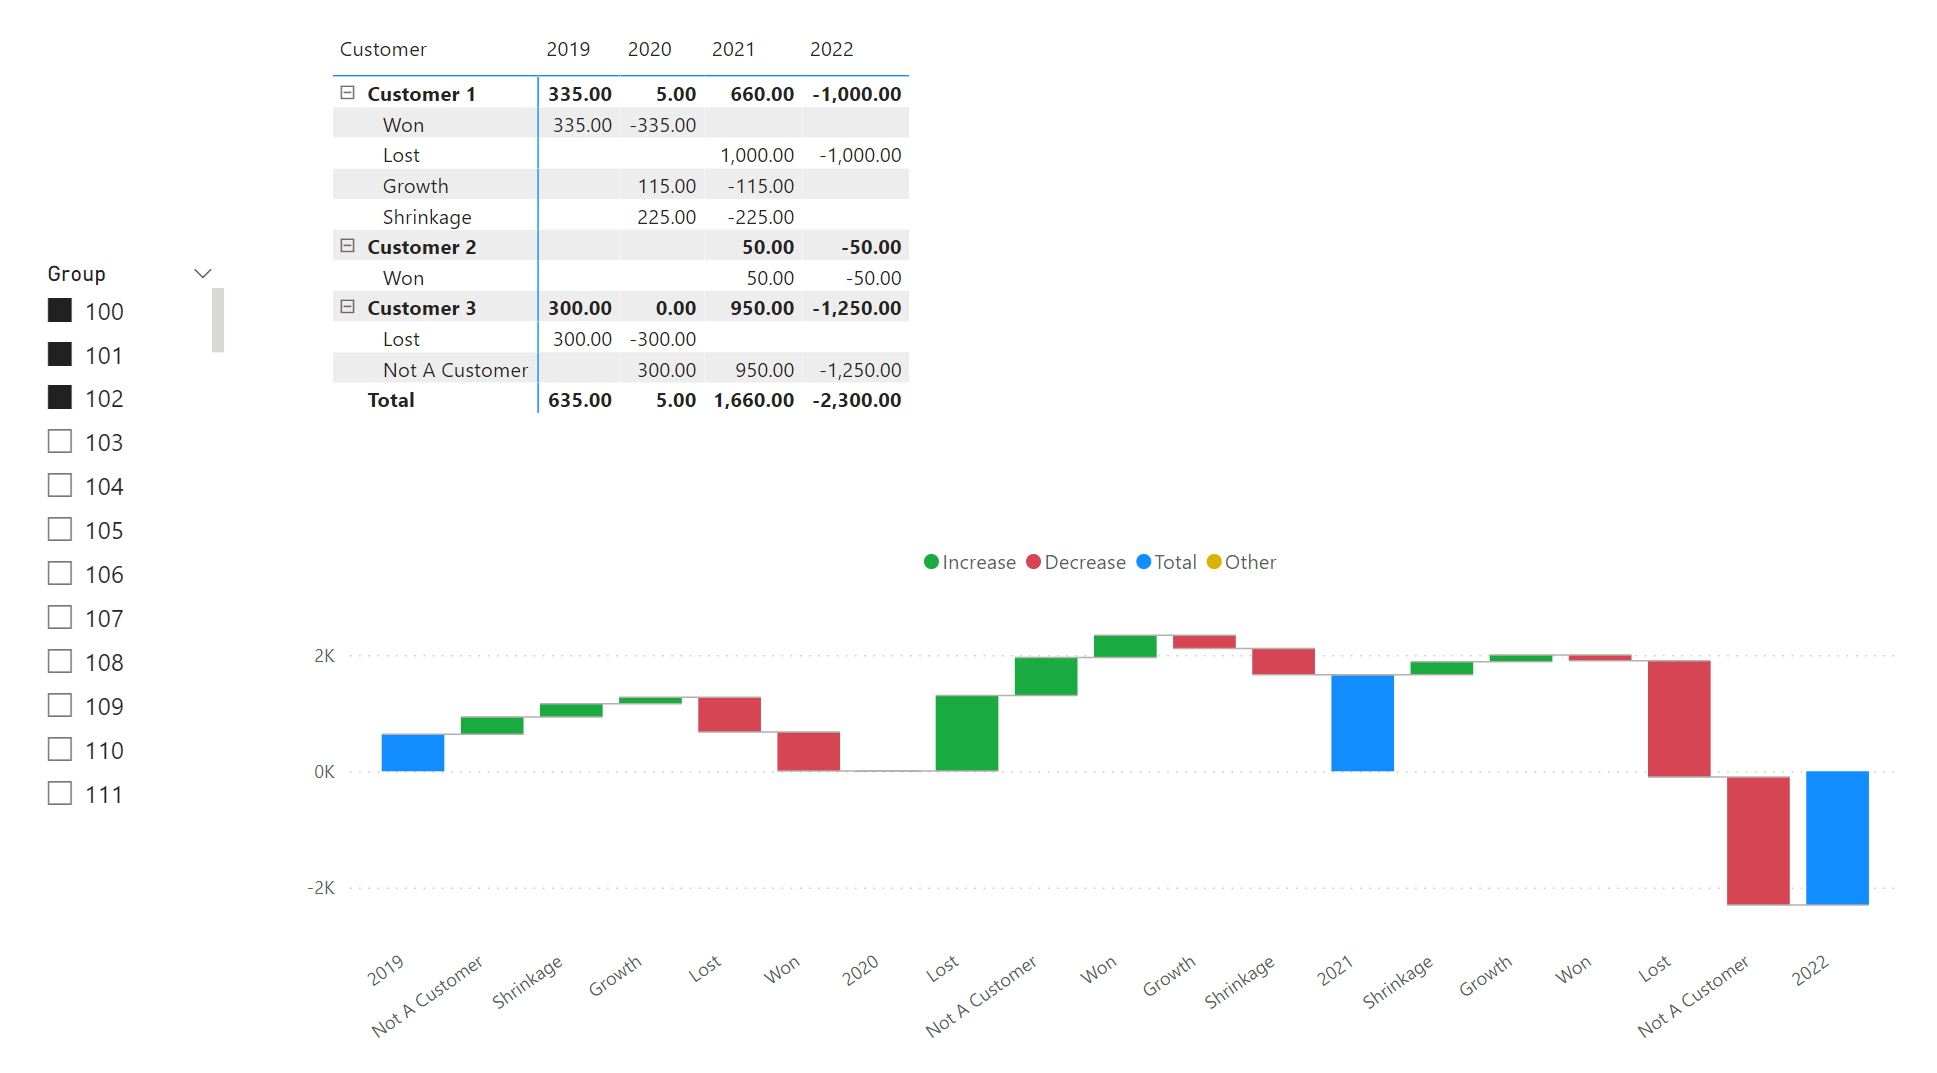
Once the transformation is done then you can create Monthly or YTD measures as per the requirements to analyze the results, as desired. Below is the screenshot of the final results provided -
I’m also attaching the working of the PBIX file as well as the link of the courses on M language or Power Query for the reference purposes.
Hoping you find this useful and meets your requirements that you’ve been looking for.
Important Notes:
1). Before you proceed ahead with the above M code or transformations, please merge the Customers and Leave table information. I’ve brought the End Date from Leavers table inside the Customers table.
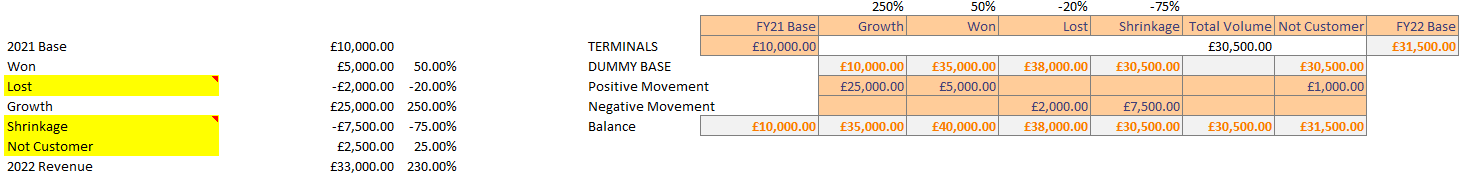
2). I’ve created couple of base measures to check or cross-verify the results. You can go ahead and create YTD or any measures as per your requirements.
3). The solution is provided based on the original query. In case of additional requirements, please modify the code as per the business scenario’s.
Thanks and Warm Regards,
Harsh
Data Model - Copy - Harsh.xlsx (1.3 MB)
Dynamic Grouping - Power Query Transformations - Harsh.pbix (415.2 KB)