Hello @kkrj.ankit,
Thank You for posting your query onto the Forum.
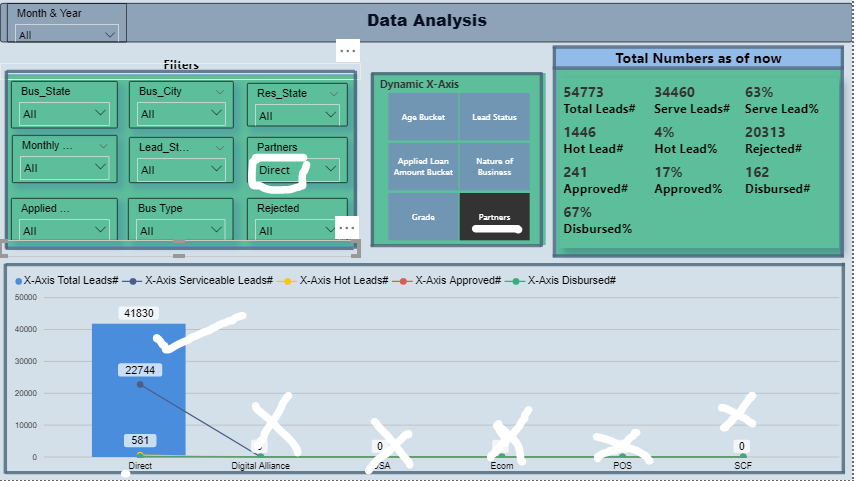
Well, is this the type of result that you’re looking for? Below is the screenshot provided for the reference -
In the above post, as you’ve suggested -
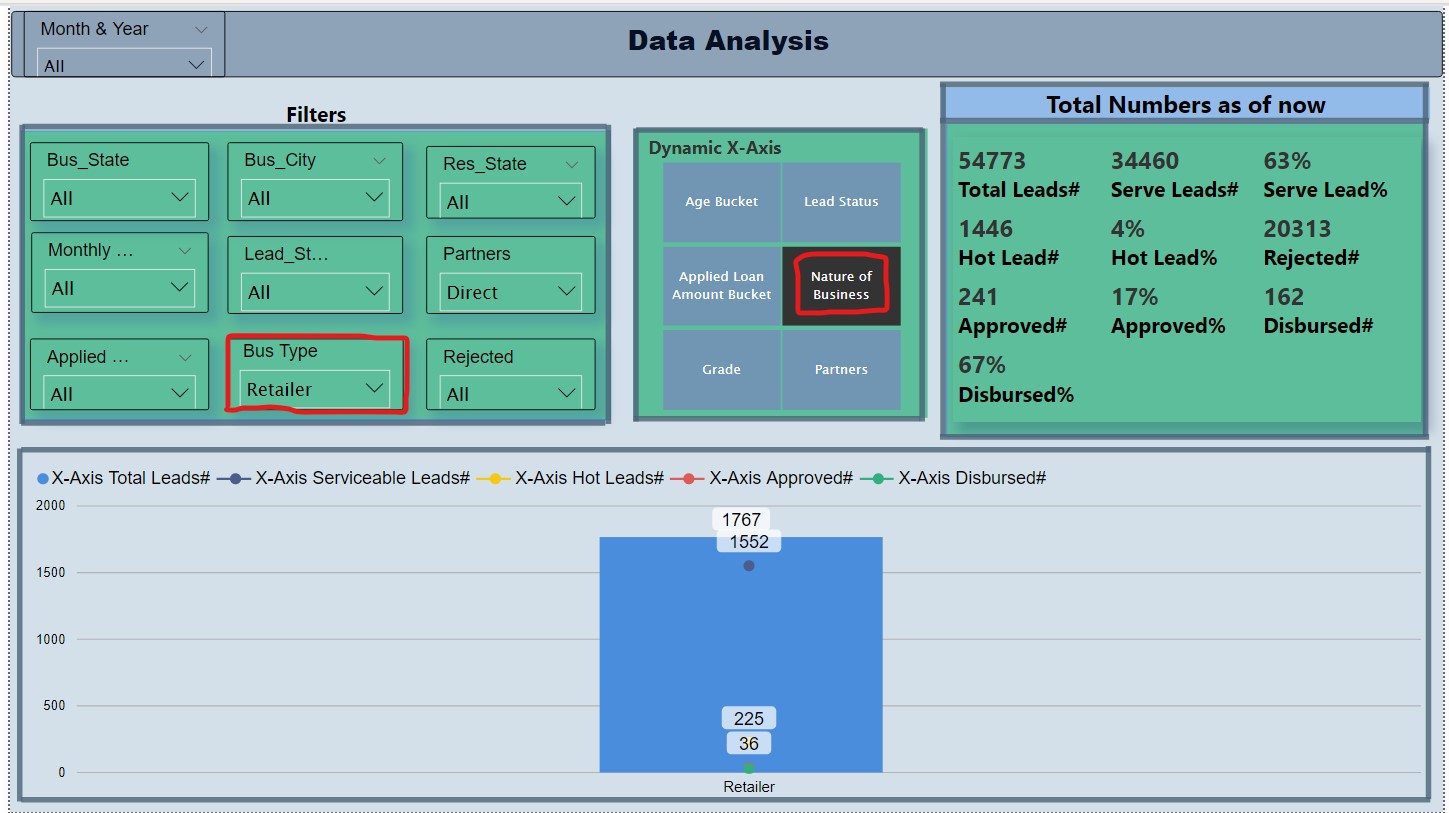
“If I select “Nature of Business” under dynamic x-axis and “bus_type” under filters then the user should be able to see a single bar of that selection.” - So I’ve highlighted those selections and achieved the results.
Now, in order to achieve this, I’d to make just a small change in the formula and i.e. here’s the original formula that you’ve written for the “Total Leads#” as mentioned below -
Total Leads# =
IF( ISBLANK( DISTINCTCOUNT ( Loan_Data[code] ) ) , 0 , DISTINCTCOUNT ( Loan_Data[code] ) )
Now, since it includes a “0” in your formula, it showed the chart which were equal to 0 as well. I’ve just replaced the “0” with the “BLANK()” and below is the formula provided for the reference -
Total Leads# =
IF( ISBLANK( DISTINCTCOUNT ( Loan_Data[code] ) ) , BLANK() , DISTINCTCOUNT ( Loan_Data[code] ) )
Also you can write the formula as follows, if you still want to include 0 but want to show greater than 0 results. Below is the formula provided for the reference -
Total Leads# =
VAR TotalLeads =
IF( ISBLANK( DISTINCTCOUNT ( Loan_Data[code] ) ) ,
    0 ,
    DISTINCTCOUNT ( Loan_Data[code] ) )

RETURN
IF( TotalLeads <= 0 ,
    BLANK() ,
    TotalLeads )
I’m also attaching the working of the PBIX file for the reference.
Hoping you find this useful and meets your requirements that you’ve been looking for. 
Thanks and Warm Regards,
Harsh
Data Analysis.pbix (1.0 MB)
 I missed that completely and was lost in other directions.