Hi all,
Please see attached example pbix: Chart with Dynamic Dates v1.pbix (131.7 KB)
I am wanting to create a line chart to show our stock trend over a time, over a period as selected by the user, eg: 1W, 2W, 1M, 3M, 6M, YTD and 1Y.
I have achieved this by using a disconnected table ‘Time Frames’, which contains Start and End dates for each option:
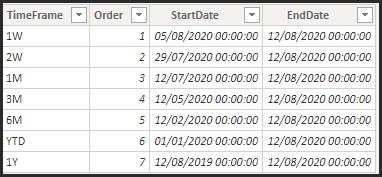
I have then got a measure Units Dynamic which returns the number of units, based on the selected date range:
Units Dynamic =
IF (
    HASONEVALUE ( 'Time Frames'[TimeFrame] ),
    CALCULATE (
        [Units],
        FILTER (
            Dates,
            Dates[Date] >= MAX ( 'Time Frames'[StartDate] )
                && Dates[Date] <= MAX ( 'Time Frames'[EndDate] )
        )
    ),
    [Units]
)
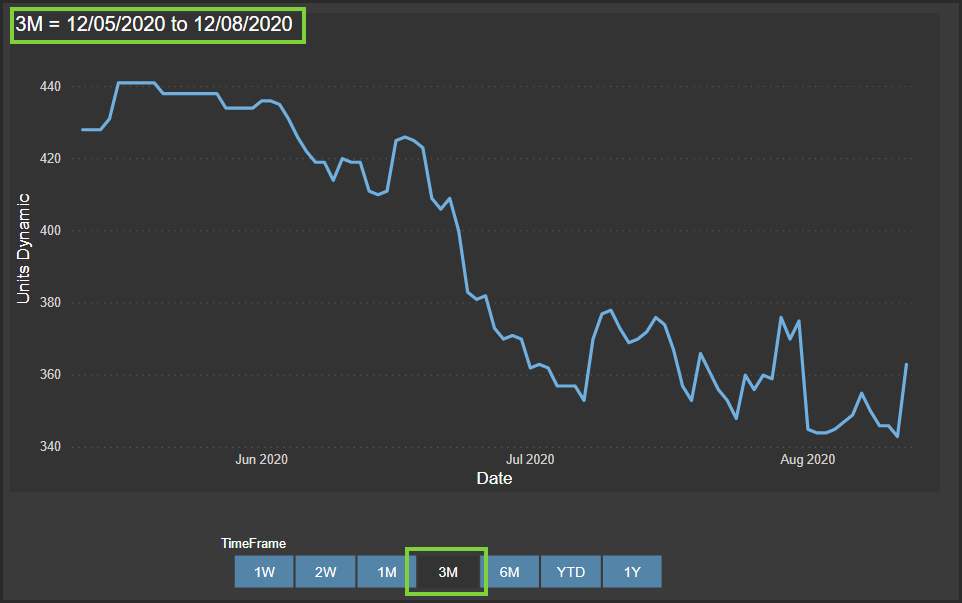
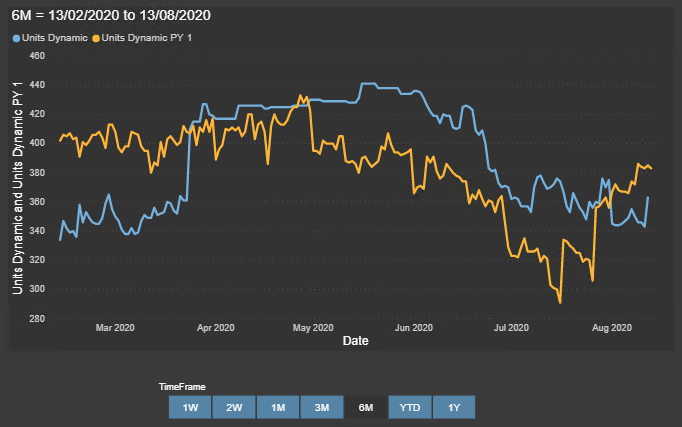
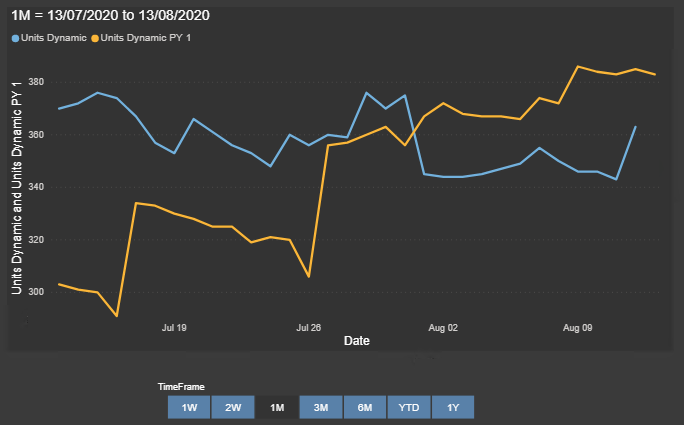
This works well so far:
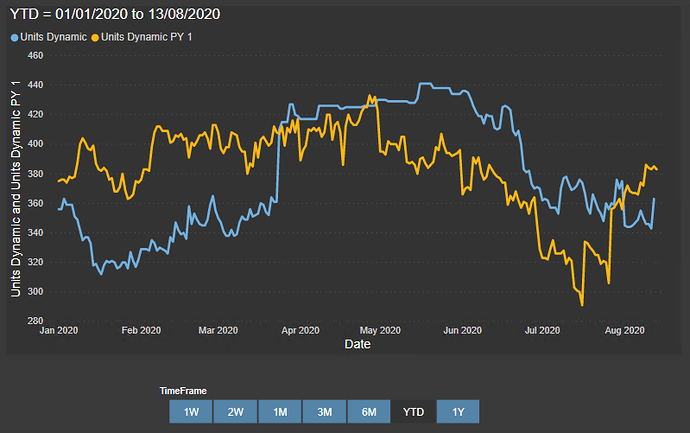
However I now want to add a line for Prior Year. I have tried creating a 2nd measure Units Dynamic PY 1 as below, however this doesn’t work.
Units Dynamic PY 1 =
CALCULATE([Units Dynamic],
    SAMEPERIODLASTYEAR(Dates[Date])
)
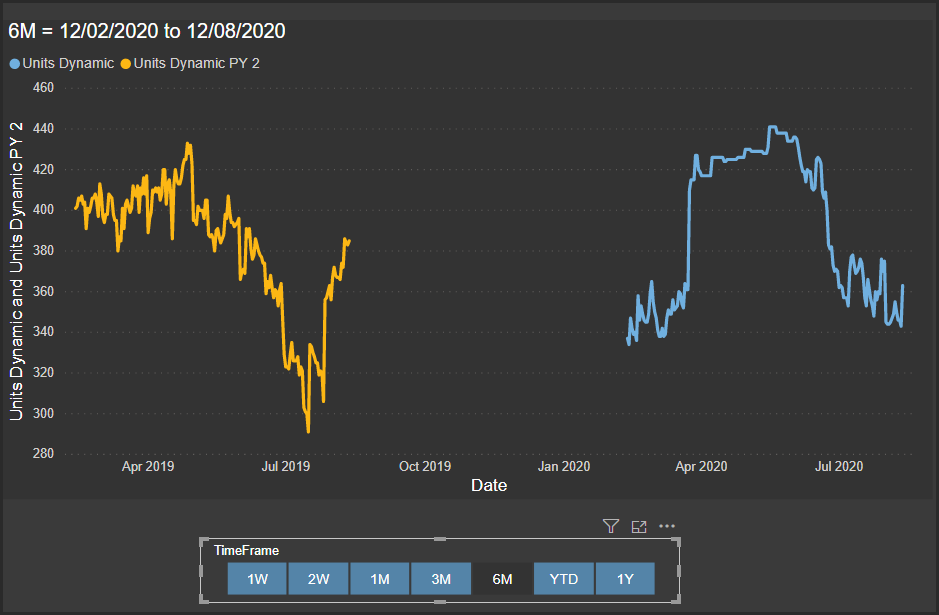
I have also tried creating a 2nd set of columns in my Time Frames table, to return the Start and End dates less 1 Year and use the same calculation as Units Dynamic, but referring to these PY columns, however this just ends up with me having two different date ranges, eg Jan -June 2019 and Jan-June 2020:
The goal is to have the Prior Year line overlaying Units Dynamic, as is usually achieved using SAMEPERIODLASTYEAR.
Any help very much appreciated!
Mark

 )
)