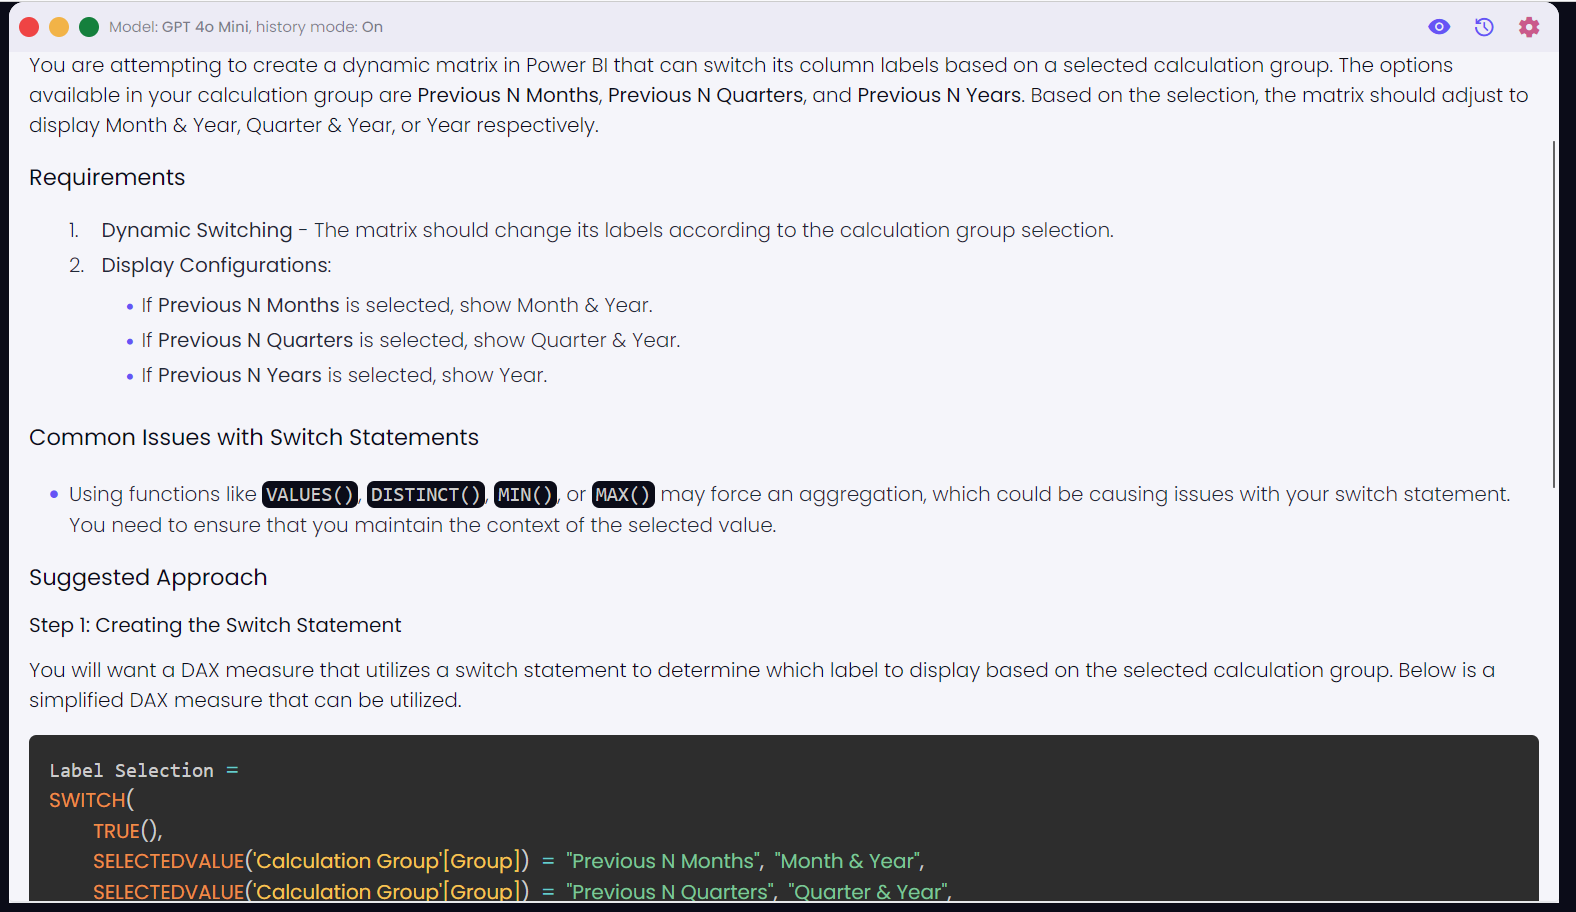
I am trying to create a matrix that utilizes a switch statement to toggle between Month & Year, Quarter & Year, and Year based on the calculation group that is selected {Previous N Months, Previous N Quarters and Previous N Years} where N is defined as the number of periods to display.
When Previous N Month is selected, I want the matrix to show Month & Year, and the same for quarter and year.
I know I can achieve creating the visual using a hierarchy or field parameter, but then it doesn’t dynamically change when you select a different option of the calculation group.
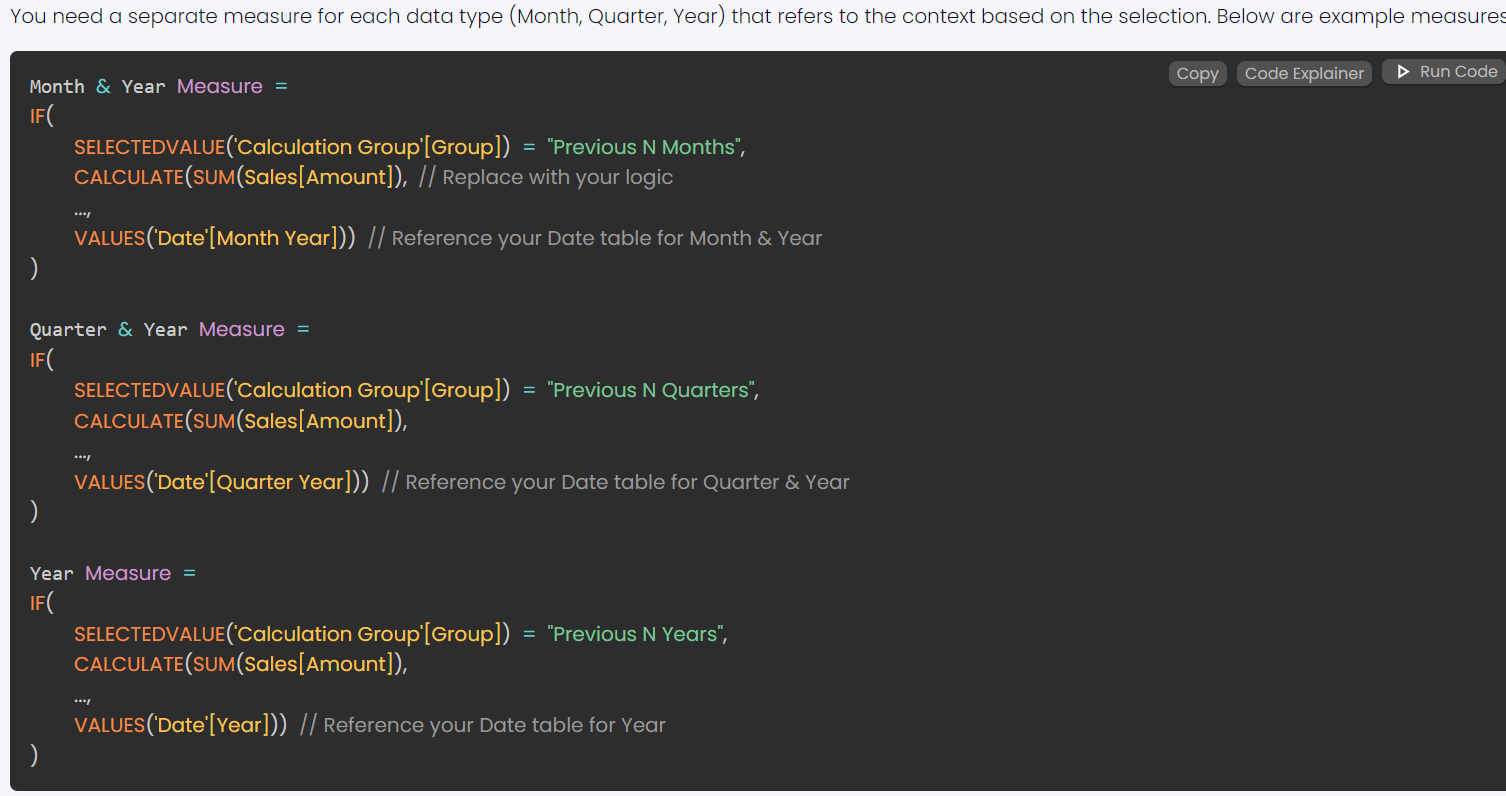
I’ve tried switch statements with VALUES(), DISTINCT(), MIN(), MAX(), and it seems the second part of the switch statement wants to force an aggregation. Any ideas? Attached is a mock report of the situation and trial. Thank you,
While we wait for other members to share their insights, we’ve taken the liberty of using “Explain Simply,” one of the tools available within Data Mentor (you can explore it here: https://mentor.enterprisedna.co/explain-simply . It generated the following results:.
Feel free to checkout more of our Data Mentor features as you work on your report. These tools are designed to help with tasks like the one you’re working on, and they might accelerate your learning curve.
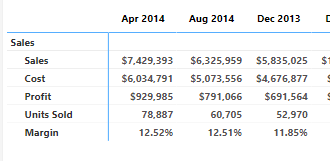
I may be dealing with too little caffeine here - but when I select your “Month & Year” option from the “Param Selected Period”
I get column headers that look like this in your table:
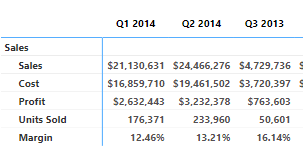
and if I select “Quarter & Year” I get this:
finally, if I select “Year”, I get this:
So I’m not sure what the issue is? It appears that the column names ARE changing.