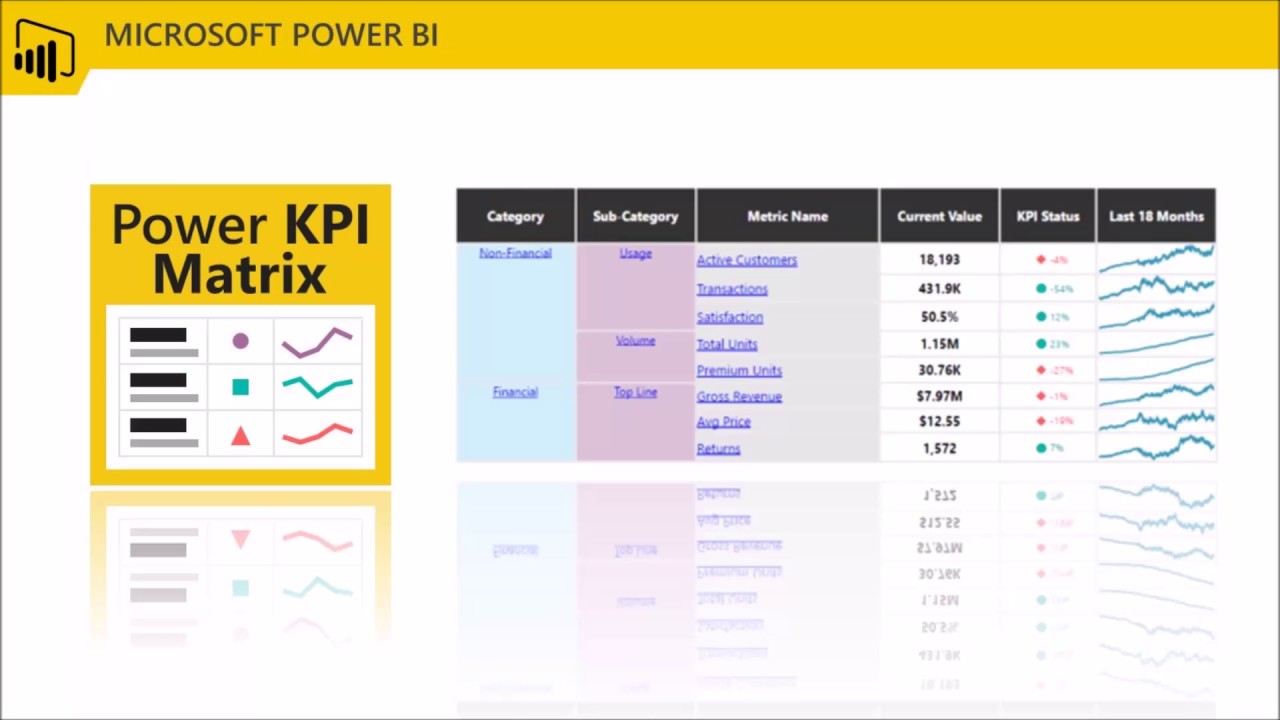
The Microsoft Power KPI visual let you do this quite easily:
You may also want to check out the OKViz sparkline custom visual by the SQLbi guys:
https://appsource.microsoft.com/en-us/product/power-bi-visuals/WA104380910?tab=Overview
Hope this is helpful.
- Brian
