I hope that everyone is well.
I am stuck in a problem as stated in detail below. Please have a look and let me know if you any solution to that.
I have created a disconnected called Time with the below columns
Time Order
Month 1
Quarter 2
Year 3
I have a table that has a category, date, customer name, amount, gross margin, profits, and so on. Also, I have created a Date table and linked it in with my main table(as mentioned in the above line).
Now, I want a matrix chart in Power BI that shows like below if I select the Month(from Time column of my disconnected table)
Similarly, for the Quarter and Year. How can we do that?
Also, it would be more good if we can replace the Previous Month text to the exact Previous Month, ie, Previous Month as of today is May 2020, so that should show May 2020 and April 2020 respectively. Similarly for the Quarter and Year one.
I want it to dynamic and always shows values based on the Time Value selected, Please help me out with this.
I would like to highlight some facts about the requirements which you have stated -
Under the Date column, you require the Growth (%) which I believe is not possible since 2 fields cannot be combined under the same heading instead what you can do is show the Growth (%) field alongside the columns of Amount(Sales) , Cost and Profit.
Previous Month Figures and Prior Previous Month Figures are in horizontal format and the Values are in the header. In this case, we cannot show 2 different types of Values under the one common Values Field because “SWITCH( TRUE() )” function cannot provide you 2 different values under the same Value field for 2 different rows. Instead what you can do is have Value Field for each i.e. Amount, Costs, Profits and Growth (%) and then mention the above conditions in each of the measure by this way you can show 2 values for separate condition under the same field.
Create one more filter visual incorporating these conditions i.e. Previous Month Figures and Prior Previous Month Figures in these you can compare your figures dynamically and it will be an Apple-to-Apple Comparison.
So overall if you incorporate these facts your table will look like this and still analyze your figures in a much more effective way and dynamic manner. Here’s the screenshot of it.
Thanks for the response. But, this all together a different format and not what I needed.
For Example, I have put a filter(that has texts- Month, Year and Quarter). This created in the Enter data section of power bi as explained earlier. It is disconnected at the moment and just have two columns (time and order). Now, let say I select Month from that filter then I want the below table to show like this Column1|Amount|Cost
Previous Month(May 2020)|50|10
Prior Previous Month(Apr 2020)|50|25
Growth(%)(which is PM/PPM)|0|-40|
We have to create this Column1 or measure by some DAX calculations either in some separate table or by using some measure calculations. I don’t want to discuss all the months as per your image and also not have to place these many filters.
It will just has one filter(TIME, which is coming from the self created table.
Hi @skathuria
I think you could solve this by creating a table for each time frame and using a button to show up the required time frame.
I think it is also more visually appealing,
I have used this technique in other scenarios, for example switching tables and bars visuals. In your case, you would use time frames
I have to do it in a single table and have to use a single filter that is set to only choose one value at a time (month year or quarter) and based on that the below table have to reflect the values.
Please let me know if you need more clarity on the requirement.
That’s is great and this is what I wanted to do. Just one thing, if that is possible then it is the 100 % solution to my requirement.
Can we change the text like Previous Month and Prior Previous Month to the exact month, ie, PM - May 2020 and PPM - Apr 2020 and that has to be dynamic based on the month we are in. Similarly for Quarter and Year.
Rest all of it is done. Thanks for helping me out. Please fix this bit now for me.
Are you sure that the values are correct?
As I checked that is not the value for the last month. Similarly for the Quarters and years.
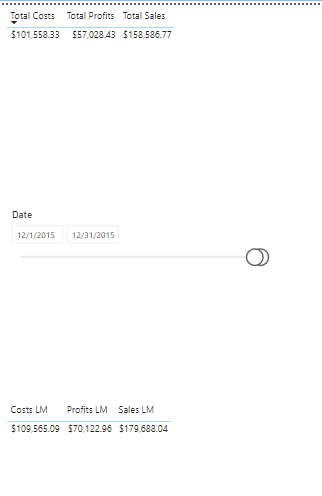
Check the below image for the LM value if I select the date. But, In general I don’t want to use the date.
Can you fix it and make it work for just the last month and the prior month?
Thanks
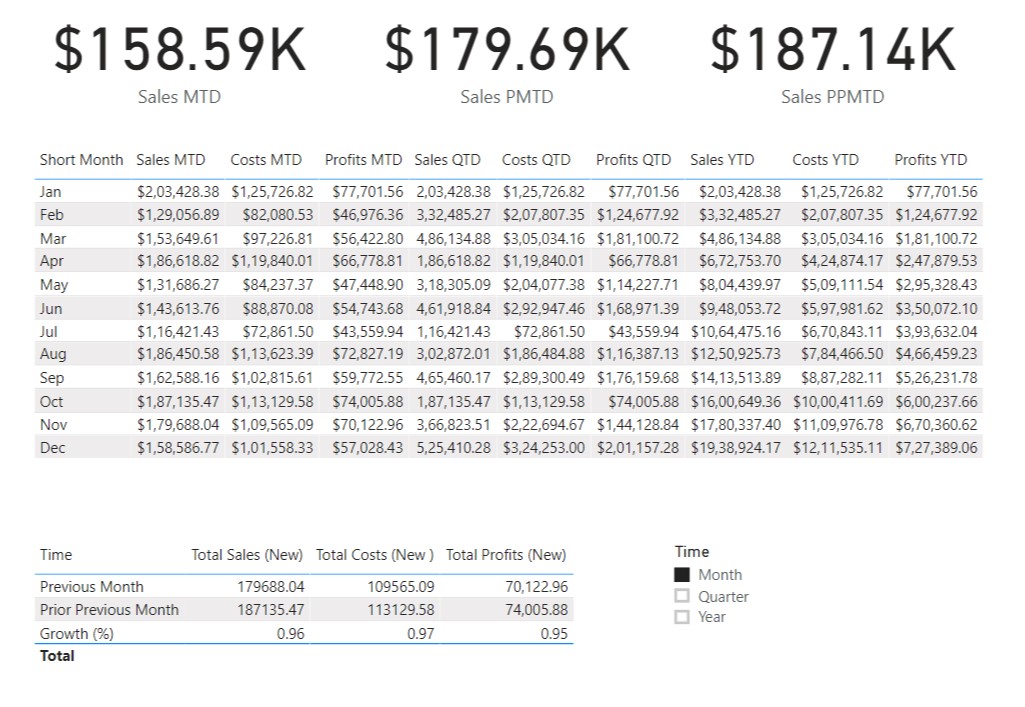
In the previous solution I had actually considered only “DATEADD()” function to calculate the figures whereas in actual firstly, it had to be “DATESMTD”, “DATESQTD” and “DATESYTD” functions used for monthly, quarterly and yearly calculations respectively and then “DATEADD” function will come into the scenario. My Apologies for the inconvenience caused.
I’m attaching the screenshot as well as the revised PBIX File of my working for the reference.
Hoping you find this useful and helps you in analysis.
Thanks for the response. I have already fixed the formulas that will incorporate without filtering the date. Also, see your updated file as well. Different approaches but works well as well mate!!!
But, Now, I want to know whether we can change the “Previous Month” text to the exact month, ie, May 2020 as of today. Similarly for others and then have the same values.
Basically want to add the more dynamic things to it. Have you tried on that?
Have tried several approaches in order to create a dynamic column be it from creating a new disconnected table to creating a column using different DAX functions but yet hasn’t yielded the definitive results.
Yeah same problem my side. For my curiosity, Have you tried creating a measure in that table that uses EOMONTH thing to get the values using today and year or other combinations.
I haven’t tried it but thinking that it might work if we can just add another column and then call that column values in our switch measure
Hi @skathuria, a response on this post has been tagged as “Solution”. If you have a follow question or concern related to this topic, please remove the Solution tag first by clicking the three dots beside Reply and then untick the check box. Thanks!
The below formula allows you to dynamically return the value of a previous period based on the selected time period. I believe it to be a more eloquent solution that the one provided.
If a month is selected the previous month would be returned, if a Quarter was selected the previous quarter results would be returned, if a Year was selected then previous year would be returned.
*Note: Month Year is a concat of Month and Year for example 201601 for January 2016
Total Value Previous Period =
VAR NumofMOnths = DISTINCTCOUNT(Dates[Month Year])
@Harsh
Give this a try, apologies If its not made in the same context as your solution but it should give you an idea of how without filters this can be achieved. Presumably PriorPP would just be NumOfMOnths*2 Dynamic Comparison based on Month, Quarter and Year (1).pbix (514.6 KB)