Hi all,
First of all, thank you for your help in advanced.
The thing I would like to achieve in Power BI is for a user of the dashboard to select a parameter, like using SELECTEDVALUE and as a result of that, the calculation of column in a table changes automatically and accordingly to the selection. Therefore, the column would have like a SWITCH formula pointing out to other columns depending on the selection. My idea is to use that to calculate a Whale Curve allowing the user to do it at different levels of aggregation.
Not sure if that could be possible by using Power Automate for forcing the column to be updated.
As an example of a similar thing, I was able to create that in Excel, with a value selected by the user in Excel and through the hit of a button, refreshing the data in Power Query by using a VBA macro, then that update cascades into Power Pivot and finally the recalculation is done in Power Pivot, displaying the different results based on the different selections done by the user in a graph in an Excel tab.
I see not having the option of creating VBA macros in Power BI a disadvantage, but maybe I’m missing something that I don’t know.
Many thanks!!
Joseba
Hi @JosebaDZN
This sounds doable by making your column a calculated column in DAX. You can then use a SWITCH formula like you mentioned to change the calculation based on the selection of a parameter.
Hard to say for sure without seeing your file/hearing the specifics but in theory it should be doable.
Thanks,
Hi @jamie.bryan
Thanks for your answer!!
In terms of creating the calculated column, that is doable. However, my main challenge is how I could allow the user of the dashboard through a radio button in the dashboard to by changing the selection to have the column recalculated based on the selection. The only way I have been able to do something similar is by having a radio button selecting one option and a measure pointing out to different columns based on the selection. However, that would mean to create many different columns, something quite challenging when trying to include many different possible options.
There’s a new feature in preview called Field Parameters; this sounds like it might give you what you need.
https://www.sqlbi.com/articles/fields-parameters-in-power-bi/
If I’m understanding what you need correctly, it should just calculate itself.
Here’s a mockup of an example:
Calculated Column.pbix (21.3 KB)
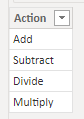
I’ve got a table for my actions:
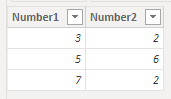
I’ve got my numbers:
I’ve got a measure getting my selected action:
Selected Action = SELECTEDVALUE( Actions[Action] )
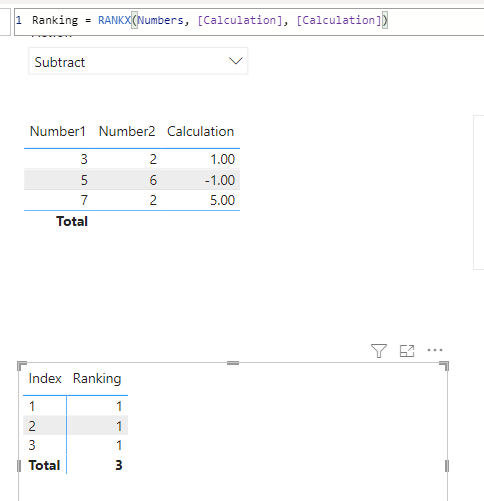
Then my switch statement changing what to do with the numbers based on what’s selected:
Calculation =
VAR number1 = SELECTEDVALUE( Numbers[Number1] )
VAR number2 = SELECTEDVALUE( Numbers[Number2] )

RETURN
SWITCH(
    TRUE(),
    Numbers[Selected Action] = "Add", number1 + number2,
    Numbers[Selected Action] = "Subtract", number1 - number2,
    Numbers[Selected Action] = "Multiply", number1 * number2,
    Numbers[Selected Action] = "Divide", number1 / number2
)
The Calculation column changes based on the selection in the slicer that the user makes.
Hi @jamie.bryan
That is something that could be working if I was not being trying to apply a Ranking to the column. The issue is that once the column is updated, I would need to create another column that would be ranking the products based on the Gross Profit and aggregated just to one level of the hierarchy. Basically, what I’m trying to do is to have a dynamic column that could change the hierarchy of aggregation for the products, such as, selecting to see the aggregation at Level 1, let’s say Retail, Wholesale and by selecting with a radio button, to modify the level of hierarchy at which the analysis is done, so Level 1, Retail Small Business, Retail Big Business, Wholesale Small Business, Wholesale Big Business. So the ranking of the products would change as the aggregation would be different.
My main goal is to be able to create a Whale Curve that could be calculated at different level of aggregation.
With the solution you provided, the limit that I have is to create a Ranking column, through a measure based on another measure.
Hi @JosebaDZN
If you’re wanting to change how it’s aggregated like that I believe the field parameters feature that @GME_TO_THE_MOON mentioned will help like they said.
Thanks,
Hi @JosebaDZN, just wanted to check if you have tried the suggestion by @GME_TO_THE_MOON. Did it help in solving your query? If not, how far did you get and what kind of help you need further? If yes, kindly mark as solution the answer that solved your query. Thanks!
Hi @JosebaDZN, we’ve noticed that no response has been received from you since a few days ago.
We just want to check if you still need further help with this post?
In case there won’t be any activity on it in the next few days, we’ll be tagging this post as Solved.
Hi,
The suggestion did not help me to find the solution as I believe what I’m trying to do is not possible yet in Power BI.
Hi @JosebaDZN, sorry to hear that. Shall we close this thread as the solution is not possible yet? I hope you find a workaround, though.
Hi @JosebaDZN, due to inactivity, a response on this post has been tagged as “Solution”. If you have a follow question or concern related to this topic, please remove the Solution tag first by clicking the three dots beside Reply and then untick the check box.