Hi,
I would like to bin my data in a dynamic way ie by being able to modify any time the segments defined for slicing my data. I saw the examples where we use a table with pre defined ranges but in this case the ranges can change according to the needs. It’s a pity that powerbi does not propose a smart bin function for doing such task.
Any thoughts?
Thanks
JS
Hi JS,
This is possible in a few ways.
Take this formula for example I used during the learning summit for dynamic segmentation
Customer Sales TY =
VAR RankingDimension = VALUES( Sales[Customer Name Index] )
VAR TotalCustomers = CALCULATE( COUNTROWS( Customers ), FILTER( ALL( Customers[Customer Names] ), [Total Sales] > 0 ))
VAR CustomerRank = [Customer Rank TY]

RETURN
CALCULATE( [Total Sales],
    FILTER( RankingDimension,
        COUNTROWS(
            FILTER( 'Customer Groups',
                CustomerRank > TotalCustomers * 'Customer Groups'[Low]
                && CustomerRank <= TotalCustomers * 'Customer Groups'[High] ) ) > 0 ) )
There’s no reason why you couldn’ place dynamic numbers where the high and low are?
Those numbers could come from what if parameter or calculations, you would just need to find a way to integrate them in.
This makes sense?
Do you have a specific example you’re working on?
I do plan to create some content about this variation in due course.
1 Like
Sam,
thanks for this quick reply - I tried but could not create the segment view. See below my example.
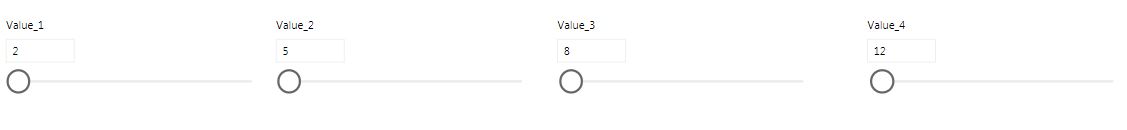
Currently i have 4 “what if” parameters (the values can go from 0 to 20).
Let’s imagine i have a list of values and i have to be able to segment these values dynamically thanks to my parameters and assign one of these groups based on the inputs in the parameters.
below value 1
value 1 - value 2
value 2 - value 3
value 3- value 4
superior to value 4
List for the example -
Column A
1
2
3
4
5
6
7
8
9
10
11
12
13
14
15
16
17
18
19
20
21
22
23
24
25
26
27
28
29
30
Check out this idea here
You will see with this formula that you can create virtual table by bring in difference values (ie. what if parameters)
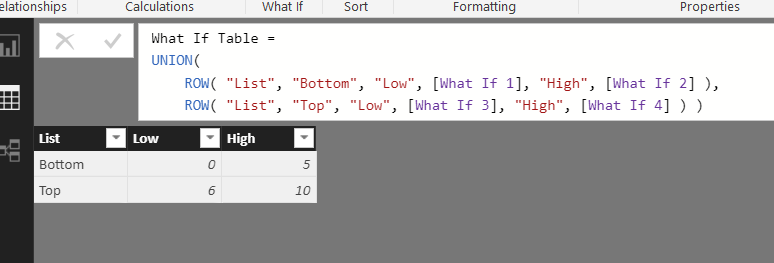
I’ve just mocked this up with the table creation feature.
The idea is that you would place this inside the segmentation formula
Like this
Customer Sales by Group =
VAR CreatedTable = UNION(
    ROW( "List", "Bottom", "Low", [What If 1], "High", [What If 2] ),
    ROW( "List", "Top", "Low", [What If 3], "High", [What If 4] ) )

RETURN
CALCULATE( [Total Sales],
	FILTER( VALUES( Customer[Customer Names] ),
		COUNTROWS(
			FILTER( CreatedTable,
				RANKX( ALL( Customer[Customer Names] ), [Total Sales],, DESC ) > [Low]
				&& RANKX( ALL( Customer[Customer Names] ), [Total Sales],, DESC ) <= [High]] ) )
			> 0 ) )
This is just an example to show you how to do it. You might need to re-arrange things a little bit but see how you go with this.