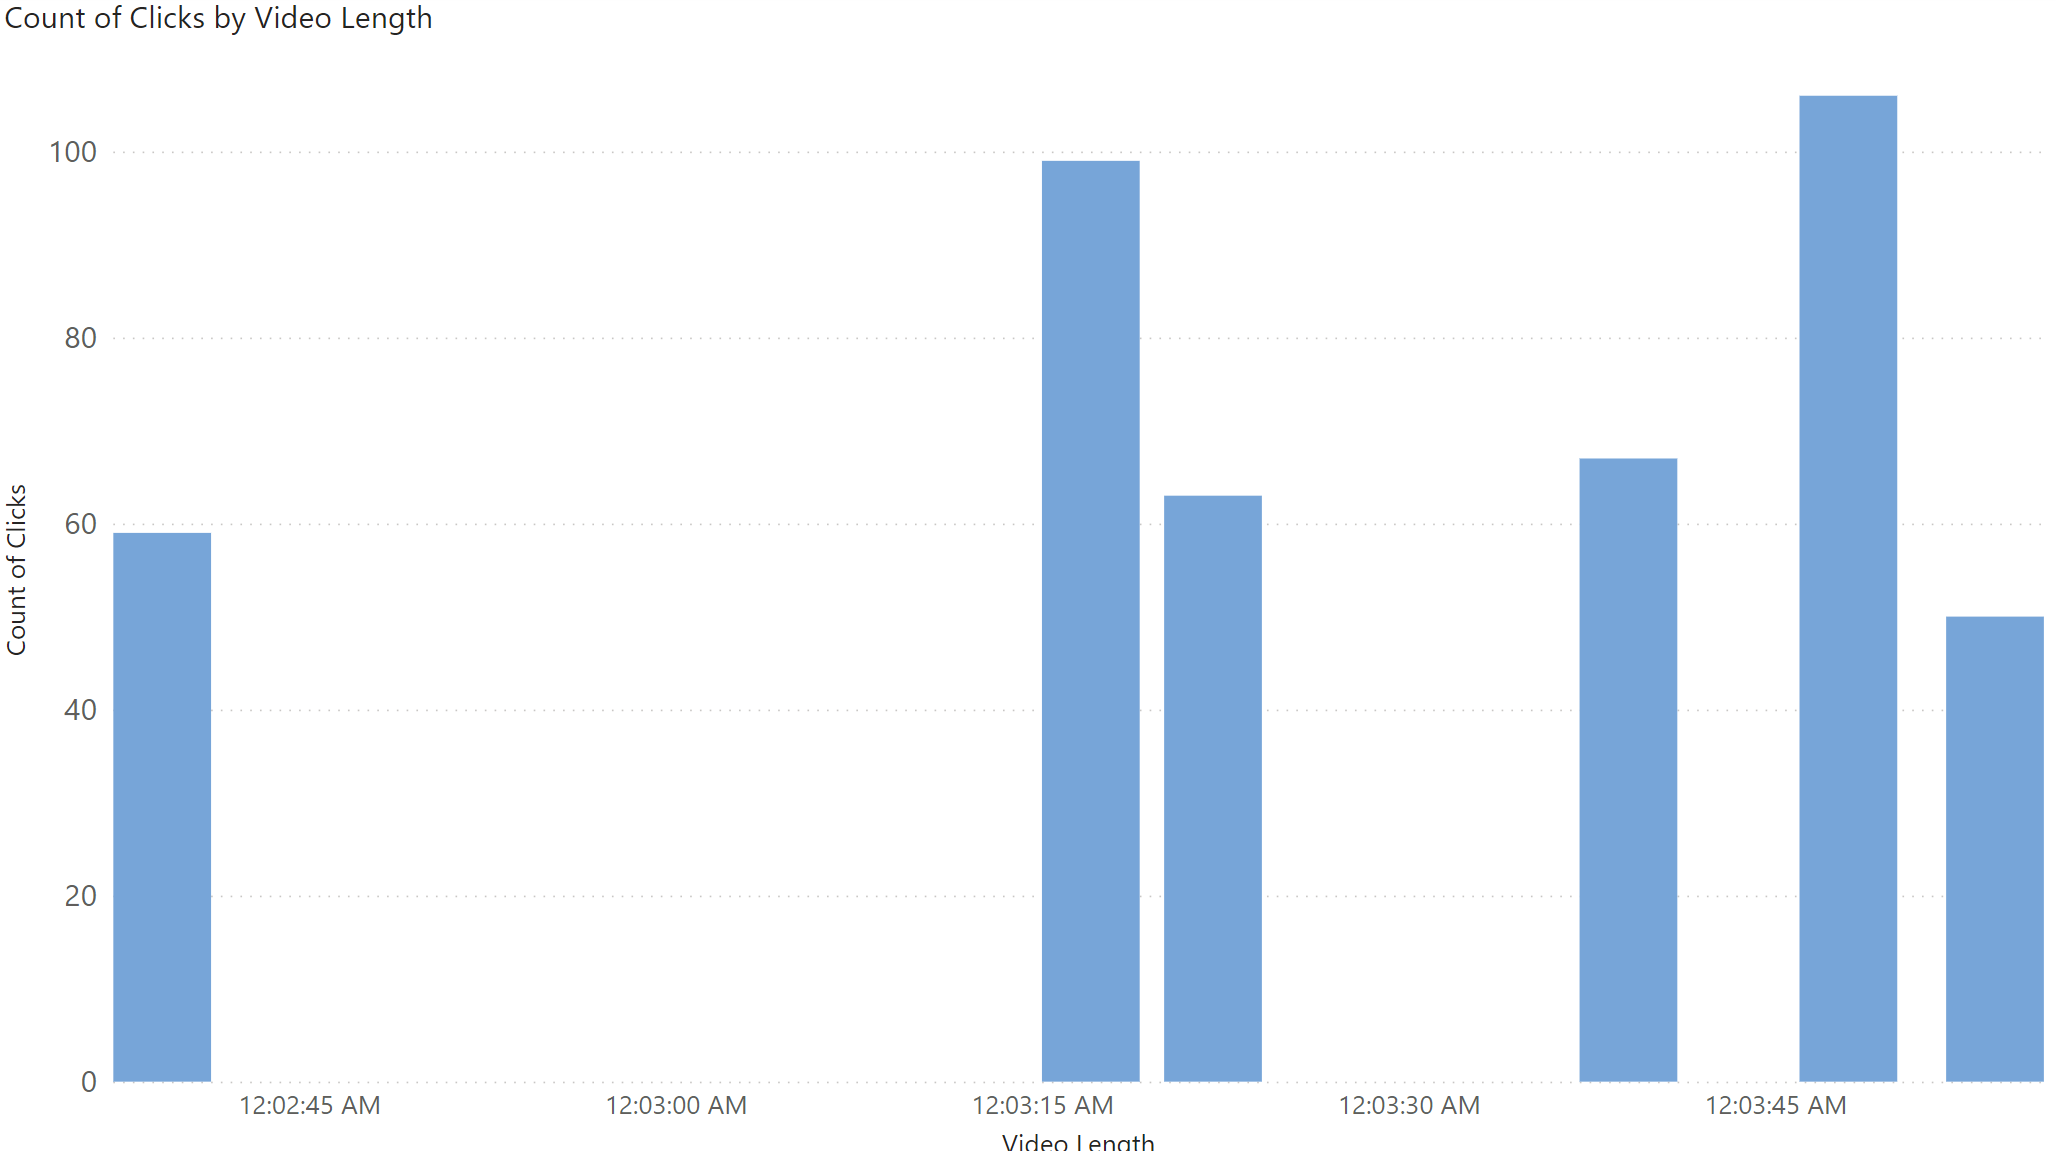
It’s everyone’s favorite topic - how to deal with duration! I have a dataset with video lengths. I want to show the distribution of clicks based on length of video (are shorter videos getting more/fewer clicks?).
Problem: no matter how I format the field, the x-axis is always formatted as 12:03:21 AM. See image above and the Format Axis tab in my pbix. I need this formatted as 3:21 (n:ss). If I use FORMAT([Video Length]), “n:ss”), it changes it to a string, and I can no longer get the seconds in between, so I can’t see how the lengths are distributed. If I use my Min-Sec field in my time table, I can’t figure out how to filter it to start at the minimum video length and end at the max length. See the Min & Max Axis tab in my pbix.
Two potential solutions:
Figure out how to format this damn field so it shows n:ss but is still in the Time format, not string
Figure out how to filter the Min-Sec from my Time table so it starts at min video length and ends at max video length
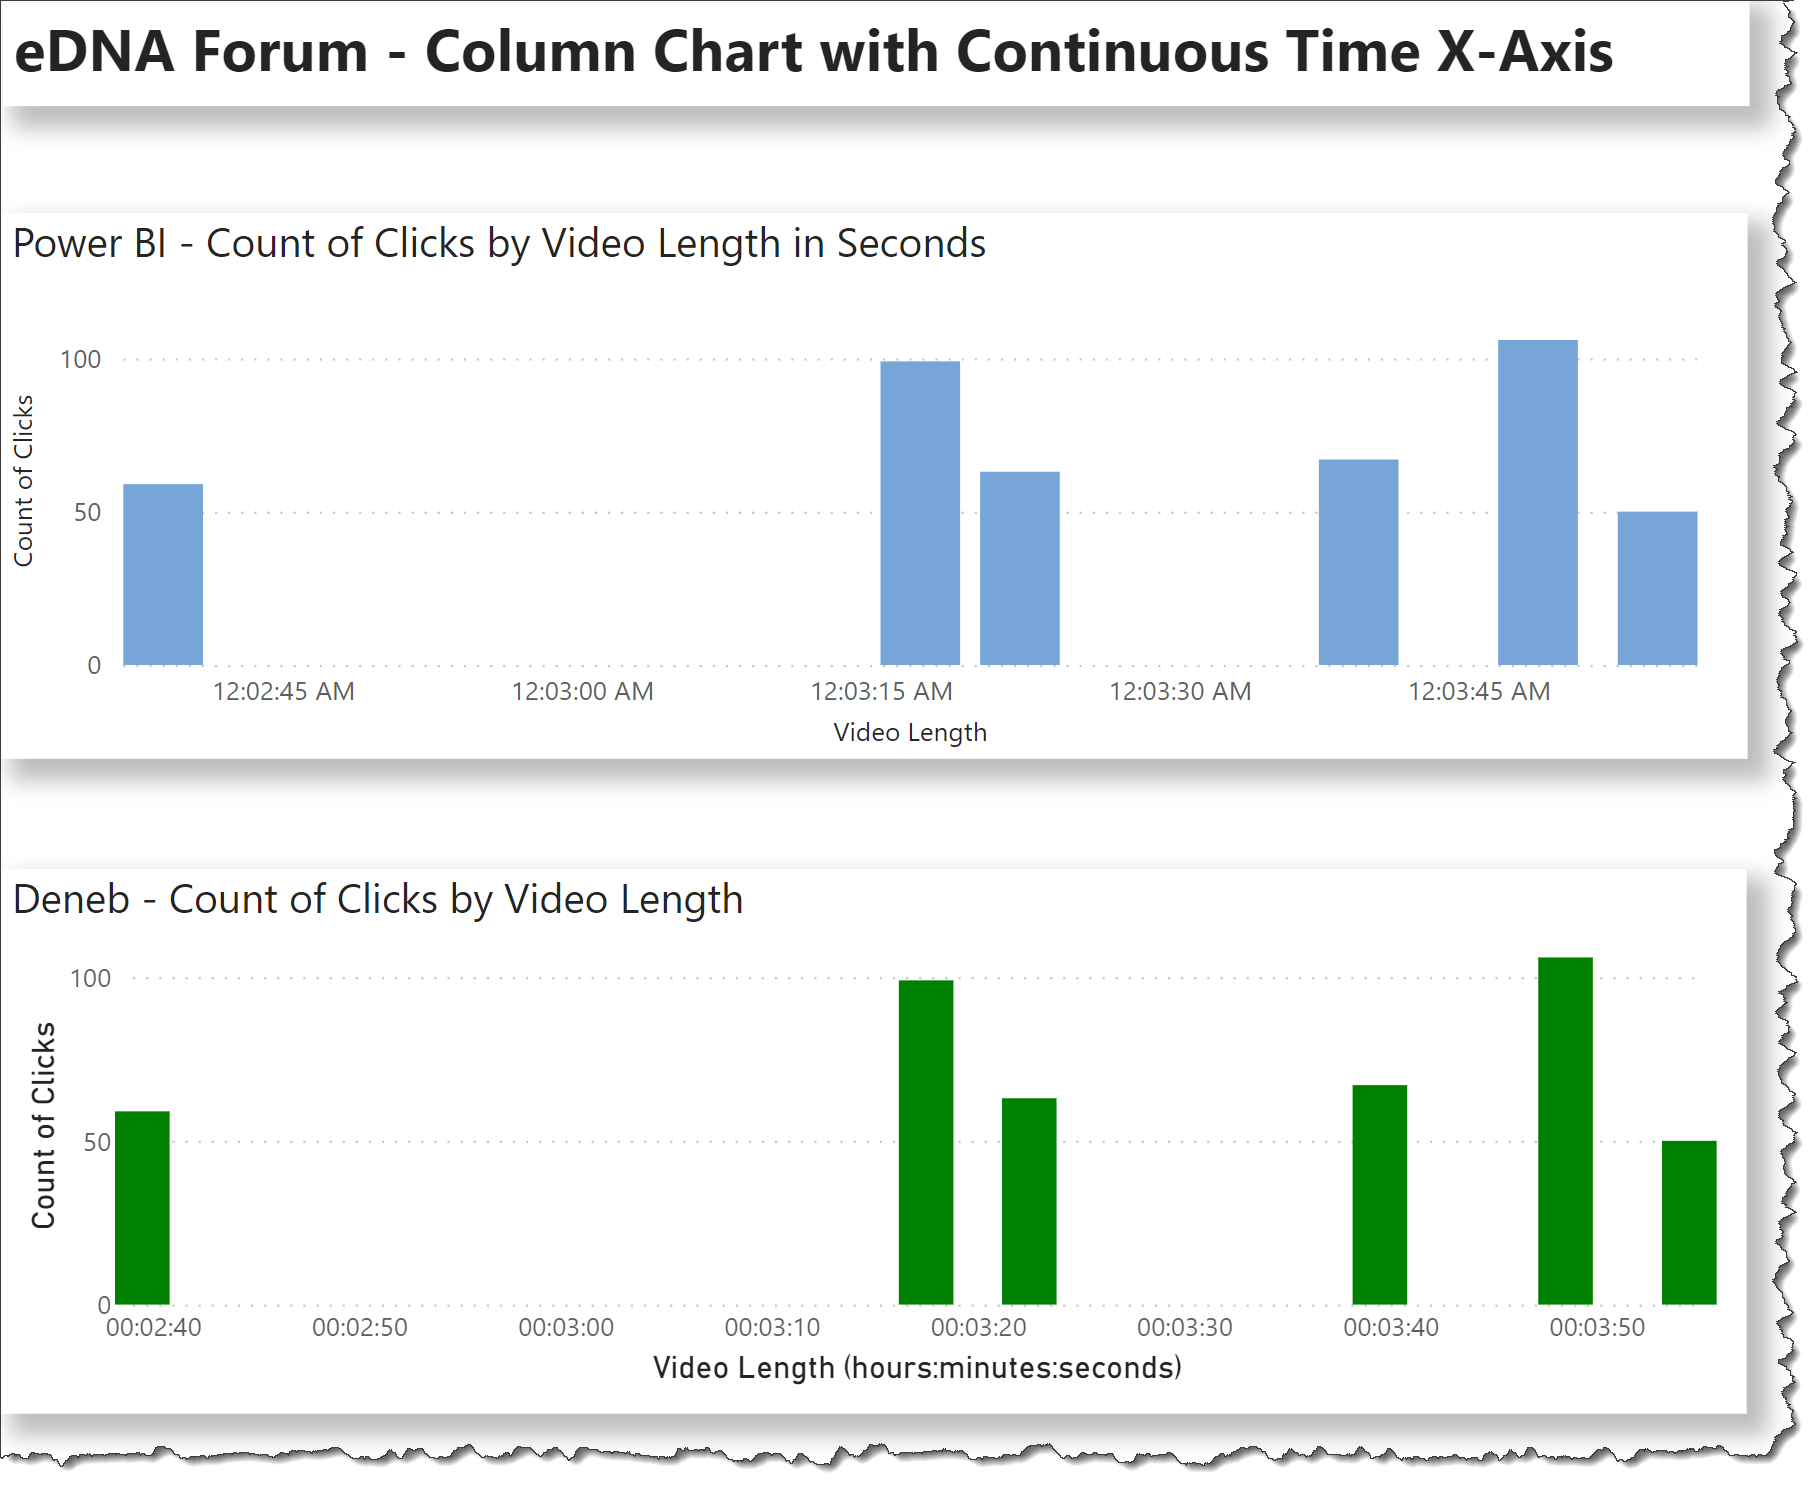
This may be a situation where you need to design a custom chart - using Charticulator (Instruction)
However, I decided to give it a shot with the default chart…
Try creating this measure:
Modified Count of Clicks =
VAR MaxClicks = MAX( Metadata[Video Length] )
VAR MinClicks = MIN( Metadata[Video Length] )
VAR SelectTime = SELECTEDVALUE( 'Time'[Time] )

RETURN
    SWITCH( TRUE(),
        SelectTime < MinClicks, BLANK(),
        SelectTime > MaxClicks, BLANK(),
        0 + [Count of Clicks] )
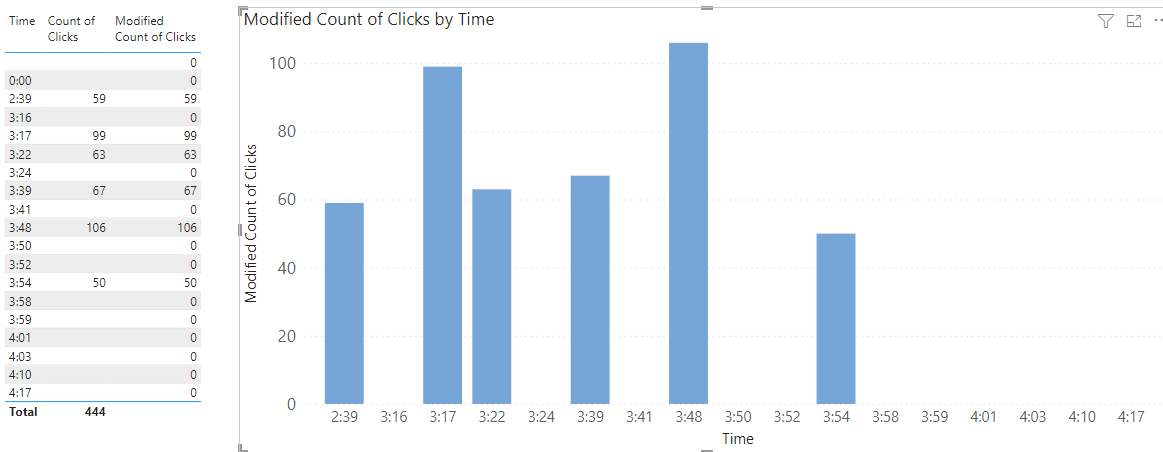
Use the above measure on your Table
be sure to change the table Axis to use ‘Time’[Time] instead of ‘Metadata’[Video Length]
change the X-axis type from Continuous to Categorical
Now, I’m hoping that your dataset has been shortened and you accidentally removed some URLs from the Clicks table that were not removed from the Metadata table (because 4:17 is clearly a valid number in the Clicks table, and so is returned as the ‘MaxClick’ time
Thanks much for the reply! Unfortunately, this still doesn’t get me every second between the shortest video and the longest. You’re right, when I modified the data for the example, I removed some info so some of these videos show as not having clicks. So what I want looks like what you showed, but for every second, not just the times that have clicks.
I’ll check out Charticular to see if it will work. I’m just so frustrated that Power BI, which exists entirely for data viz, doesn’t allow something as simple as formatting the x-axis…
P.S.: I saw your sample PBIX was built in Report Server … not sure if Deneb is available for Report Server, but I’ve attached my example PBIX just in case its helpful eDNA Forum - Column Chart with Continuous Time X-Axis.pbix (2.8 MB)
Hi @Gaelan, did the response provided by experts help solve your query? If not, how far did you get and what kind of help you need further? If yes, kindly mark as solution the answer that solved your query. Thanks!
Hi @Gaelan, it’s been a while since we got a response from you. In case there won’t be any activity on it in the next few days, we’ll be tagging this post as Solved.
Hi @Gaelan, due to inactivity, a response on this post has been tagged as “Solution”. If you have a follow question or concern related to this topic, please remove the Solution tag first by clicking the three dots beside Reply and then untick the check box.