Hi All,
I’m challenging myself trying to solve a riddle just using DAX.
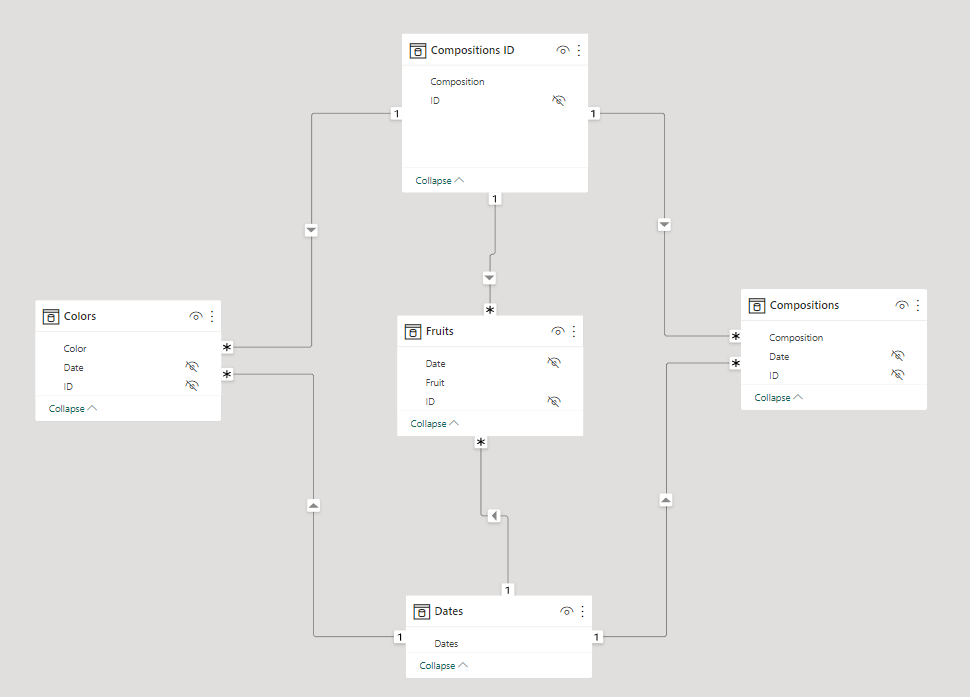
I have a model shaped like this. Production is a bit more complex, but this essentially fits the purpose.
The Compositions ID table lists the unique IDs from Compositions (the one in production has many more attributes).
Now I want to list in a table the Composition attribute from the Compositions ID table, one or more attributes from the Compositions table (in this case just Composition), and the number of colors and fruits.
When I do it I get duplicated in the table. I’ve tried table expansion, virtual relations using TREATAS and CROSSFILTER to activate relations between tables Compositions and Color and Fruits, but the issue persists.
I know that a good model would simplify or sometimes eliminate the need for complex DAX, but as I said this is a challenge, I ventured into, maybe without the proper knowledge.
Hi @Roberto - The measures I provided seems to be interacting with the Slicers on new page. Please provide more information on what is needed or what is not working.
Additionally will request in future, try to put the entire requirements in one go and not in parts as this becomes difficult/time consuming for the person helping on the posts and will bring delays for you also.
I’ll try to make my ask more clear.
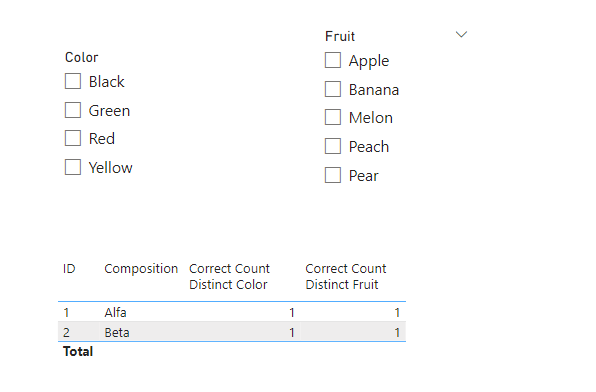
In the model, I have slicers on colors and fruit.
The behavior of the report is correct when I select one value of those slicers, showing only the lines with values.
In the case below picking red the “Correct Count Distinct Color” shows no values, so the Correct Count Distinct Fruit.
I’d need the table to show no rows since one of the slicers (in this case the color) produces no values.
In short I need to replicate the filter on the slicer like I had a one-to-many relation between dimension tables Colors or Fruit, and a fact table.
Hi @ankit,
I got the logic.
Since I have three tables (color, fruit, and one more) in the real model, I’ll just have to add a new section and add to the IF one more condition.