In a normal Excel pivot table when you double click on a cell you can see the build out of that number i.e. the underlying numbers/transactions making up the summary figure, which sometimes might be many thousand rows of data. However in PowerPivot or PowerBI.com Analyse in Excel the number of rows is limited to 1000 rows. Does anyone know how to override that 1000 number
It might be easier and more clear if I show you it rather than try to explain it
I personally don’t know any way around this, but can’t you just setup a report page in Power BI with the right filters so you can get all this information. Power BI is just perfect for this type of filtering and would solve this scenario.
sorry for digging up the old posts, but I actually have a solution for this, so maybe I can help out.
Allso I diddn’t search the entire forum to see whether this question was posted again on a later date.
but here goes:
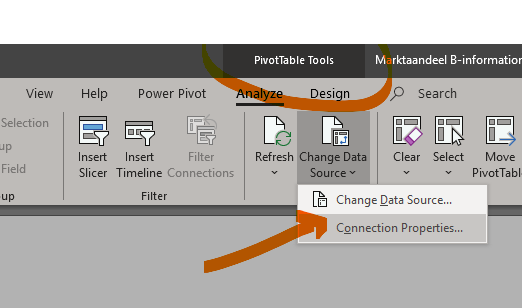
On the pivottable (you got from Analyse in Ecxel)
go to the Pivottable tools - Change Data Source - Connection Properties
on the Usage tab, adjust the OLAP drill Through Max number of records to retrieve