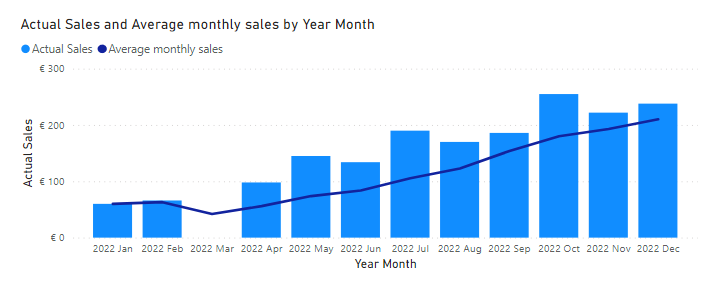
I would like to be able to drill down on a customer and the following chart be seen. The time frame for the Axis would be the last invoicing date and back 12mths ie a rolling 12mths
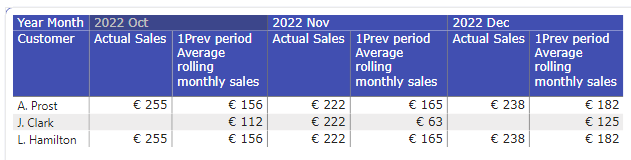
At the moment the drill down chart only shows the same period that is in the table below ( I have used filter pane in this demo - the production model uses the MonthOffset of the extended date table to limit what is shown and the user has that option on a slicer)
Is it possible to remove the filter relating to time frame for the axis and replace it with the rolling 12 months from the date of the last invoice? Drilldown change filter for charts - Copy.pbix (129.5 KB)
Hi @AliB. Shouldn’t be a problem. Update your DAX measure as desired to show only what you want, and adjust “Keep All Filters” settings on the main and drillthrough pages. Perhaps that will help.
Greg
Managed to figure it out from you tube if anyone else looking. It involves another date table with a many to one relationship with the existing date table. My chart always shows the last twelve months now
Previous 12M Revenue =
VAR ReferenceDate = MAX(Dates[Date] )
VAR PreviousDates =
    DATESINPERIOD(
        'Previous Date'[Date],
        ReferenceDate,
        -12,
        MONTH
    )
VAR Result =
    CALCULATE(
        [Revenue],
        REMOVEFILTERS(dates),
        KEEPFILTERS (PreviousDates),
        USERELATIONSHIP(Dates[Date],'Previous Date'[Date] )
    )
Return
     Result