Hello,
I have a table of donor ids, dates, and amounts.
How can I find the most loyal continuous donor. That is a donor who has donated at least once every year.
I have reviewed the churn model, and this doesn’t quite fit.
Thanks
Hello,
I have a table of donor ids, dates, and amounts.
How can I find the most loyal continuous donor. That is a donor who has donated at least once every year.
I have reviewed the churn model, and this doesn’t quite fit.
Thanks
Hello @Synergetic,
Thank You for posting your query onto the Forum.
Well, it would be great if you could attach the working of the PBIX file so that members of our forum can provide the better results efficiently. If your file contains the sensitive data/information you can hide the data and then provide the expected results that you’re looking for. One of our expert member @BrianJ has already created a video based on this topic about “ How To Mask The Sensitive Data ”. I’m providing a link below of that video.
Thanks and Warm Regards,
Harsh

Hi Harsh
I have stripped out identifyable information and cut the dataset down.
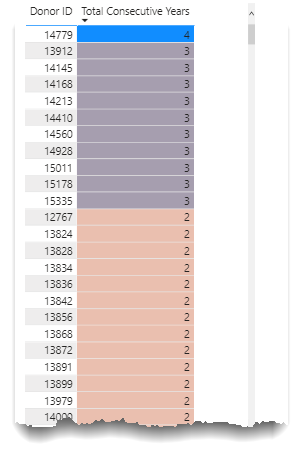
As can be seen from the dashboard it calculates those donors that have donated every year for up to 10 years.
What I need to do is from the database of all donation, identify the ones that have donated every year the longest periods. That is, they may have stopped donating, but were a loyal donor.
Also note, that some donors donate many times a year. Therefore we can’t just count the donations.
Donor loyalty.pbix (405.1 KB)
This is a really interesting problem. I think I’ve got a good solution for you, but it’s throwing a weird error right at the end of the code. I’m consulting with @Melissa on fixing that error and hope to have something to you relatively soon.
– Brian
Thanks Brian.
I have tried a few different things but keep getting stuck on the multiple donations per year
@Synergetic SQLBI wrote a DAX pattern that exactly suits your requirement:
Here’s a full Power Query solution. Note that the dataset included is only a thousand records, since I got tired of watching PQ grind through 50,000 records as I was building the solution. Should work fine on your full dataset though.
Basic logic is that it groups by Donor ID then subtracts the year of the current record from the year of the next record. If it’s a 1 (indicating consecutive year) it keeps the record, otherwise it gets filtered out. At the last step all the data gets regrouped by Donor ID and the 1s all get totaled up, indicating the number of consecutive years associated with each donor ID.
Here’s the full M code:
let
    Source = Excel.Workbook(File.Contents("C:\Users\brjul\Desktop\CSVs\AllRecordedDonationsTable.xlsx"), null, true),
    AllRecordedDonationsTable_Sheet = Source{[Item="AllRecordedDonationsTable",Kind="Sheet"]}[Data],
    #"Promoted Headers" = Table.PromoteHeaders(AllRecordedDonationsTable_Sheet, [PromoteAllScalars=true]),
    #"Changed Type" = Table.TransformColumnTypes(#"Promoted Headers",{{"Donor ID", Int64.Type}, {"Receipt Amount", Int64.Type}, {"Receipt Date", type datetime}, {"Constuency Codes", type text}, {"Column5", type text}, {"Column6", type text}}),
    #"Merged Columns" = Table.CombineColumns(#"Changed Type",{"Constuency Codes", "Column5", "Column6"},Combiner.CombineTextByDelimiter(",", QuoteStyle.None),"Merged"),
    #"Renamed Columns" = Table.RenameColumns(#"Merged Columns",{{"Merged", "Constituency Codes"}}),
    #"Changed Type1" = Table.TransformColumnTypes(#"Renamed Columns",{{"Receipt Date", type date}}),
     #"Inserted Year" = Table.AddColumn(#"Changed Type1", "Year", each Date.Year([Receipt Date]), Int64.Type),
    #"Renamed Columns1" = Table.RenameColumns(#"Inserted Year",{{"Year", "Receipt Year"}}),
    #"Sorted Rows" = Table.Sort(#"Renamed Columns1",{{"Donor ID", Order.Ascending}, {"Receipt Year", Order.Ascending}}),
    #"Grouped Rows" = Table.Group(#"Sorted Rows", {"Donor ID", "Receipt Year"}, {{"Count", each Table.RowCount(_), Int64.Type}, {"Annual Donations", each List.Sum([Receipt Amount]), type nullable number}}),
    #"Sorted Rows1" = Table.Sort(#"Grouped Rows",{{"Donor ID", Order.Ascending}, {"Receipt Year", Order.Ascending}}),
    #"Filtered Rows" = Table.SelectRows(#"Sorted Rows1", each [Annual Donations] > 0),
    #"Sorted Rows2" = Table.Sort(#"Filtered Rows",{{"Donor ID", Order.Ascending}, {"Receipt Year", Order.Ascending}}),
    AddedIndex = Table.AddIndexColumn(#"Sorted Rows2", "Index", 0, 1, Int64.Type),
    BufferedTable = Table.Buffer(AddedIndex),
    #"Added Custom1" = Table.AddColumn(AddedIndex, "Consecutive.1", each try if [Donor ID] = BufferedTable[Donor ID]{[Index] + 1} then
[Receipt Year] - BufferedTable[Receipt Year]{[Index] + 1}  else 0 otherwise 0),
    #"Reordered Columns" = Table.ReorderColumns(#"Added Custom1",{"Donor ID", "Receipt Year", "Count", "Consecutive.1", "Annual Donations", "Index"}),
    #"Inserted Absolute Value" = Table.AddColumn(#"Reordered Columns", "Absolute Value", each Number.Abs([Consecutive.1]), type number),
    #"Filtered Rows1" = Table.SelectRows(#"Inserted Absolute Value", each true),
    #"Added Custom" = Table.AddColumn(#"Filtered Rows1", "Consecutive Years", each if [Absolute Value] = 0 then 1 else [Absolute Value]),
    #"Filtered Rows2" = Table.SelectRows(#"Added Custom", each ([Consecutive Years] = 1)),
    #"Grouped Rows1" = Table.Group(#"Filtered Rows2", {"Donor ID"}, {{"Total Consecutive Years", each List.Sum([Consecutive Years]), type number}})
in
    #"Grouped Rows1"
I hope this is helpful. Full solution file and data file attached. Big thanks to @Melissa, who helped me debug one final pesky error.
@Synergetic
There is also a video by @sam.mckay that might help you in understanding how you can do it via DAX:

FYI - please take a look at the results this solution produces to see if it gets you what you need, but also @Melissa and I are continuing to work on this one to explore the possible case where someone donates for a consecutive period, stops donating and then continues donating for another consecutive period.
Hi @BrianJ @Melissa
Thanks for your work on this. It is an interesting approach for a small dataset.
The problem is that the dataset I gave you was a small subset of 10 years information. Production is 150 years of information. 
Given that it took nearly an hour to process 50,000 records, it is does not scale well to millions of records. I think the longest step is the final grouping by ID. I am wondering if there is a way of improving this
Yup – I hear you on that. Personally, I like to tackle these types of questions both to try to be helpful but also to try to improve my Power Query skills. At this point in my Power Query development, my focus has been more on getting the correct solution than in optimizing my code for speed, although I hope to get to the point where I can do both simultaneously. In this case, it turns out that the next row construct I used for calculating whether a row pair was consecutive was EXTREMELY inefficient from a speed standpoint.
@Melissa on the other hand, can do both seemingly effortlessly and has been working in parallel with me on this one to develop a more efficient approach, one that also remedies the prior logic flaw that we identified earlier. She will be posting her version soon, which I know will run much faster than mine, and even on a huge dataset may be workable via scheduled refresh.
Hi @Synergetic,
Can you let me know if this performs any better. You can omit the last step, if that is not required, it just retains one record per ID with it’s maximum number of consecutive years.
let
    Source = Excel.Workbook(File.Contents(FileLocation), null, true),
    AllRecordedDonationsTable_Sheet = Source{[Item="AllRecordedDonationsTable",Kind="Sheet"]}[Data],
    PromoteHeaders = Table.PromoteHeaders(AllRecordedDonationsTable_Sheet, [PromoteAllScalars=true]),
    ChangeType = Table.TransformColumnTypes(PromoteHeaders,{{"Donor ID", Int64.Type}, {"Receipt Amount", Int64.Type}, {"Receipt Date", type datetime}, {"Constuency Codes", type text}, {"Column5", type text}, {"Column6", type text}}),
    ExtractYear = Table.TransformColumns(ChangeType,{{"Receipt Date", Date.Year, Int64.Type}}),
    RenameColumn = Table.Buffer( Table.RenameColumns(ExtractYear,{{"Receipt Date", "Receipt Year"}})),
    GroupRows = Table.Group(RenameColumn, {"Donor ID"}, {{"AllRows", each _, type table [Donor ID=nullable number, Receipt Amount=nullable number, Receipt Year=number, Constituency Codes=text]}}),
    Transformed = Table.AddColumn(GroupRows, "Temp", each
        let
            myTable = [AllRows],
            GroupRows = Table.Group(myTable, {"Donor ID", "Receipt Year"}, {}),
            SortRows = Table.Sort(GroupRows,{{"Receipt Year", Order.Ascending}}),
            AddIndex = Table.Buffer( Table.AddIndexColumn(SortRows, "Index", 0, 1, Int64.Type)),
            AddCustom = Table.AddColumn(AddIndex, "Custom", each
                try if [Index] <> List.Max(AddIndex[Index])
                    then [Receipt Year] = AddIndex[Receipt Year]{[Index]+1}-1
                    else [Receipt Year] = AddIndex[Receipt Year]{[Index]-1}+1
                otherwise false),
            NewGroup = Table.Group(AddCustom, {"Donor ID", "Custom"}, {{"Count", each Table.RowCount(_), Int64.Type}, {"AllRows", each _, type table [Donor ID=nullable number, Receipt Year=number, Index=number, Custom=logical]}}, GroupKind.Local),
            ConsecutiveYears = Table.AddColumn(NewGroup, "Consecutive Years", each if [Custom] = true then [Count] else 1, Int64.Type)
        in
            ConsecutiveYears, type table [Donor ID=Int64.Type, Custom=logical, Count=Int64.Type, AllRows=table, Consecutive Years=Int64.Type])[[Temp]],
    ExpandTable = Table.ExpandTableColumn(Transformed, "Temp", {"Donor ID", "Consecutive Years"}, {"Donor ID", "Consecutive Years"}),
    MaxConsecutiveYears = Table.Group(ExpandTable, {"Donor ID"}, {{"Max Consecutive Years", each List.Max([Consecutive Years]), type nullable number}})
in
    MaxConsecutiveYears
Like @BrianJ already mentioned if scheduled this might be acceptable.
I hope this is helpful.
Hi @Melissa
That certainly seems far more performant on my 50K record set, only taking a few seconds!
Thanks
Okay, now that just hurts my feelings. ![]()
Just kidding – that’s freaking awesome.
Thanks for all your help
Hello @BrianJ and @Melissa
Thanks for your awesome assistance on the donor loyalty.
The information brought out is fantastic,
It did raise an interesting question. We can tract the number of loyal donors year on year now, but how can we identify those that were loyal donors, but who have fallen away this year.
So we want to identify those that have donated every year for three consecutive years up to 2019 (so 2017, 2018, 2019) but who have not thus far donated in 2020. We want to then give them a final chance to make the cut for 2020.
How do we identify those people?
Regards
Hi @Synergetic,
Great to hear this is working well for you. 
Would you be so kind to create a new topic for your follow up question and @mention me?
I’d be happy to look into that with you. I’ll leave you with something to think about…