Don’t know how to attach pbix file to this forum.
Simplified data and data model. Dimensions: Date, Terminal. Facts: Model transactions, Measures: Sales.
Relationships: [Date].[Date] → [Model Transactions].[DISCHARGE_DATE] (default), Date].[Date] → [Model Transactions].[MODEL_DATE] (inactive), [Terminals].TERMINAL → [Model Transactions].[TERMINAL]
- I have a situation where Sales are forecasted each day for each terminal aggregated sales. However, they want to track the Day over Day impact of forecast changes (e.g. the Delta). I’ve tried USERELATIONSHIP but no success. I feel there is another way, but not clear.
Any help would be great.
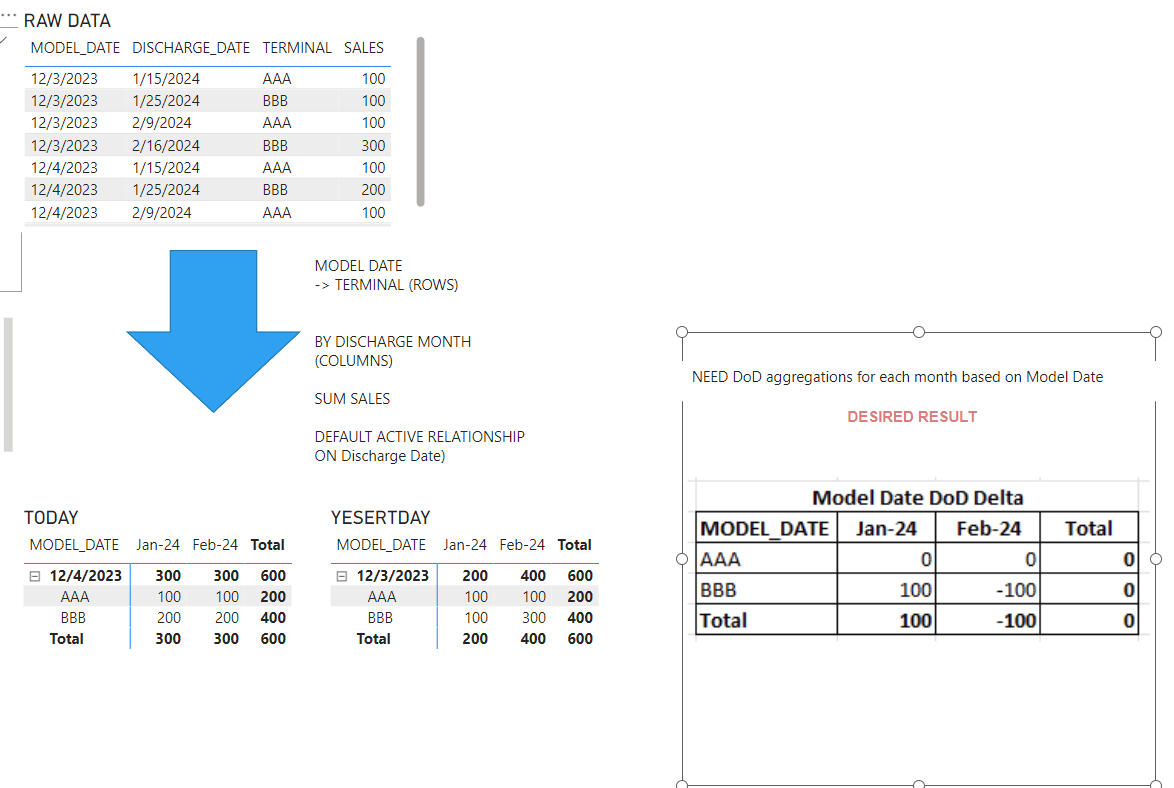
RAW Data
|MODEL_DATE|DISCHARGE_DATE|TERMINAL|SALES|
|12/3/2023|1/15/2024|AAA|100|
|12/3/2023|2/9/2024|AAA|100|
|12/3/2023|1/25/2024|BBB|100|
|12/3/2023|2/16/2024|BBB|300|
|12/4/2023|1/15/2024|AAA|100|
|12/4/2023|2/9/2024|AAA|100|
|12/4/2023|1/25/2024|BBB|200|
|12/4/2023|2/16/2024|BBB|200|
12/4/2023 Model Date
| MODEL_DATE | 12/4/2023 | ||
|---|---|---|---|
| Sum of SALES | Column Labels | ||
| Row Labels | Jan | Feb | Grand Total |
| AAA | 100 | 100 | 200 |
| BBB | 200 | 200 | 400 |
| Grand Total | 300 | 300 | 600 |
12/3/2023 Model Date
| MODEL_DATE | 12/3/2023 | ||
|---|---|---|---|
| Sum of SALES | Column Labels | ||
| Row Labels | Jan | Feb | Grand Total |
| AAA | 100 | 100 | 200 |
| BBB | 100 | 300 | 400 |
| Grand Total | 200 | 400 | 600 |
Final Desired Result
TEST_DATA.xlsx (9.7 KB)
EDNA_DoD_On_Roll_Play_Dates.pbix (849.7 KB)
|Model Date DoD Delta|
|MODEL_DATE|Jan-24|Feb-24|Total|
|AAA|0|0|0|
|BBB|100|-100|0|
|Total|100|-100|0|