Ravi85
January 24, 2021, 1:03pm
1
Hi,
I’m looking for below results and can anyone help with dax please?
Date
Trans ID
Product ID
No of Times Sold
01/01/2021
44197Product 1
Product 1
1
01/01/2021
44197Product 2
Product 2
2
02/01/2021
44198Product 1
Product 1
2
02/01/2021
44198Product 2
Product 2
3
03/01/2021
44199Product 1
Product 1
1
03/01/2021
44199Product 2
Product 2
2
04/01/2021
44200Product 1
Product 1
2
04/01/2021
44200Product 2
Product 2
1
05/01/2021
44201Product 1
Product 1
1
05/01/2021
44201Product 2
Product 2
1
06/01/2021
44202Product 1
Product 1
3
06/01/2021
44202Product 2
Product 2
1
07/01/2021
44203Product 1
Product 1
2
07/01/2021
44203Product 2
Product 2
1
08/01/2021
44204Product 1
Product 1
4
08/01/2021
44204Product 2
Product 2
1
10/01/2021
44206Product 1
Product 1
1
10/01/2021
44206Product 2
Product 2
5
11/01/2021
44207Product 1
Product 1
2
11/01/2021
44207Product 2
Product 2
2
New Object : If( Product ID = Product 1, COUNTDISTINCT(Trans ID) else Sum(No of Times Sold))
thanks
Ravi85
January 24, 2021, 2:54pm
2
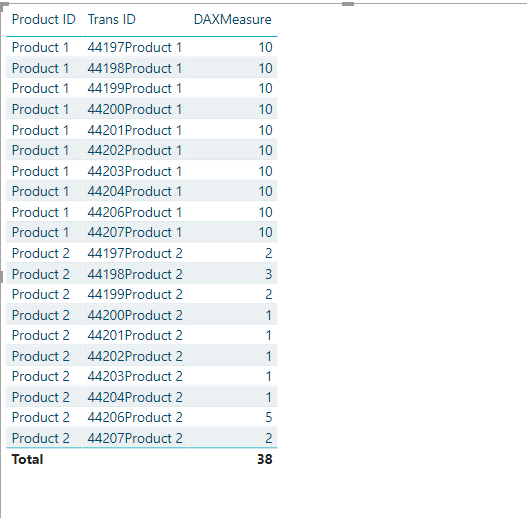
i tried using below calculated measure
Hi Ravi85,
DAXMeasure =
    IF ( SELECTEDVALUE ( TABLE1[Product ID]) = "Product 1",
                CALCULATE( DISTINCTCOUNT( TABLE1[Trans ID] ), FILTER( ALL( TABLE1 ) ,TABLE1[Product ID] = "Product 1" ) ),
                SUM(TABLE1[No of Times Sold] ) )
Ravi85
January 24, 2021, 3:50pm
4
akila789:
IF ( SELECTEDVALUE ( TABLE1[Product ID]) = "Product 1",
                CALCULATE( DISTINCTCOUNT( TABLE1[Trans ID] ), FILTER( ALL( TABLE1 ) ,TABLE1[Product ID] = "Product 1" ) ),
                SUM(TABLE1[No of Times Sold] ) )
Thanks Akila…but the total seems incorrect without product context
What I understood is this need to work under product context. Otherwise DAX can not understand which row having which product. Do you need to select a product from filter then show the product count in visual ?
Ravi85
January 24, 2021, 3:57pm
6
for now i need to show a chart based on product and no of transactions.
i believe this should work and above switch function is giving me the same result.